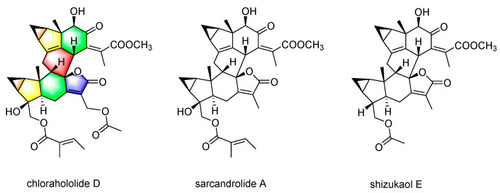
Chemical structure of chlorahololide D, sarcandrolide A, and shizukaol E.

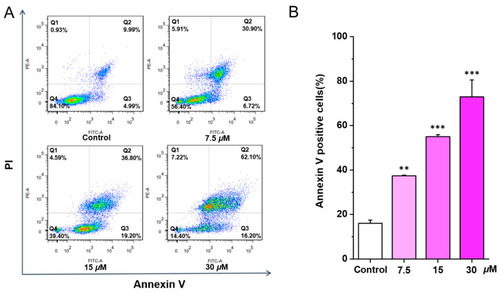
Chlorahololide D triggered apoptosis in MCF-7 cells. Various concentrations of chlorahololide D (7.5, 15, and 30 μM) were administrated to MCF-7 cells and incubated for 48 h. Cells were stained with Annexin V and propidium iodide (PI), and detected by flow cytometry subsequently. (A) Flow cytometric analysis of MCF-7 cells with the treatment of chlorahololide D. (B) Histogram of the proportions of apoptotic cells at 48 h after being treated with chlorahololide D. The results are expressed as mean ± SD. ** p < 0.01 and *** p < 0.001 vs. control group.

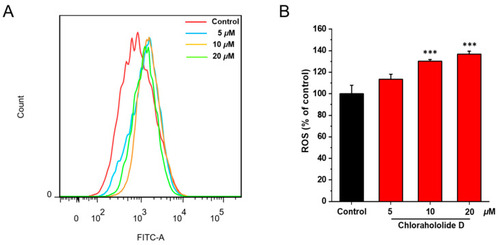
Chlorahololide D increased ROS production in MCF-7 cells. MCF-7 cells were incubated with chlorahololide D (5, 10, and 20 μM) for 48 h. MCF-7 cells were stained with DCFH-DA and detected by the flow cytometer. (A) Flow cytometric analysis of MCF-7 cells after being treated with chlorahololide D. (B) Histogram of relative ROS levels. The results are expressed as mean ± SD. *** p < 0.001 vs. control group.

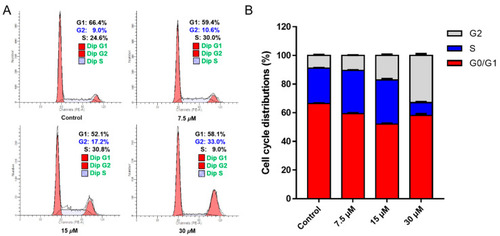
Chlorahololide D arrested G2 phase in MCF-7 cells. MCF-7 cells were treated with chlorahololide D (7.5, 15, and 30 μM) for 48 h. (A) The cells were harvested and stained with propidium iodide (PI), and the cell cycle distribution was detected using flow cytometry. (B) Histogram of cell cycle phases distribution. Data from three separate experiments are presented as mean ± SD.

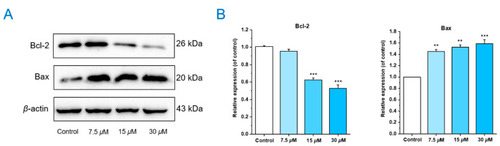
Chlorahololide D regulated apoptosis-related proteins. MCF-7 cells were pre-treated with chlorahololide D for 36 h, and Western blotting analysis was carried out. (A) The expression of Bcl-2 and Bax. (B) Histogram of the protein relative expression levels. β-actin protein was used as an internal reference. The results are presented as mean ± SD. ** p < 0.01 and *** p < 0.001 vs. control group.

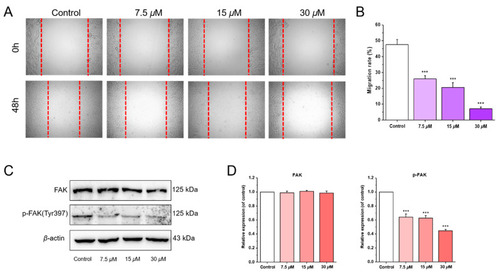
Chlorahololide D inhibited MCF-7 cells migration via regulating migration-related proteins. MCF-7 cells were pre-treated with chlorahololide D for 48 h, and Western blotting analysis was carried out. (A) MCF-7 cells were photographed at 0 h and 48 h. (B) Histogram of the migration rate (%). (C) The expression of FAK and p-FAK. (D) Histogram of the protein relative expression levels. β-actin protein was an internal reference. The results are expressed as mean ± SD.*** p < 0.001 vs. control group.

Chlorahololide D inhibited proliferation and migration in vivo. CM-DiI stained MCF-7 cells were microinjected into 2 dpf zebrafish embryos. After 4 h, tumor-bearing embryos were treated with chlorahololide D (2.5, 5, and 10 μM) for 48 h (n = 15/group). Etoposide (10 μM) was used as the positive control. (A) Intensity and distribution of the red fluorescence were photographed using a confocal microscope of disseminated foci in zebrafish. (B) The proliferation was quantified by ImageJ software. (C) The metastasis of MCF-7 cells was analyzed using ImageJ software. All of the results are expressed as the mean ± SD. * p < 0.05 and *** p < 0.001 vs. the control group.

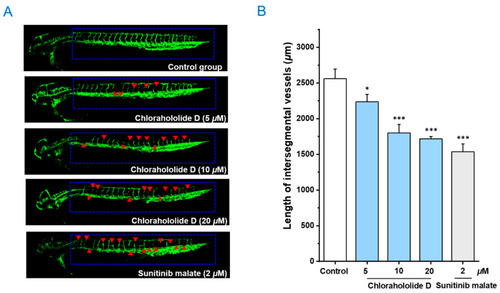
The embryos of transgenic zebrafish Tg(fli1: EGFP) were treated with the positive control, sunitinib malate (2 μM), and chlorahololide D (5, 10, and 20 μM) for 48 h. (A) Representative images of ISVs in zebrafish under a confocal microscope. (B) The average length of ISVs in zebrafish after treatment with sunitinib malate and chlorahololide D (5, 10, and 20 μM) (n = 15/group). All of the results are expressed as the mean ± SD. * p < 0.05 and *** p < 0.001 vs. the control group.

Acknowledgments
This image is the copyrighted work of the attributed author or publisher, and ZFIN has permission only to display this image to its users. Additional permissions should be obtained from the applicable author or publisher of the image. Full text @ Molecules