
Image
|
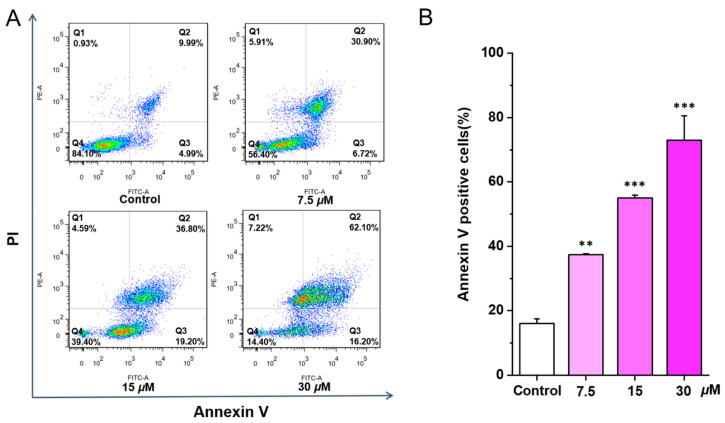
Figure Caption
Figure 2
Chlorahololide D triggered apoptosis in MCF-7 cells. Various concentrations of chlorahololide D (7.5, 15, and 30 μM) were administrated to MCF-7 cells and incubated for 48 h. Cells were stained with Annexin V and propidium iodide (PI), and detected by flow cytometry subsequently. (
Acknowledgments
This image is the copyrighted work of the attributed author or publisher, and
ZFIN has permission only to display this image to its users.
Additional permissions should be obtained from the applicable author or publisher of the image.
Full text @ Molecules