
Image
|
Figure Caption
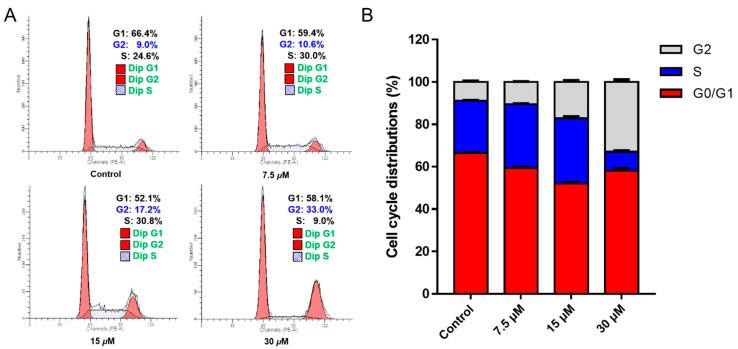
Figure 4
Chlorahololide D arrested G2 phase in MCF-7 cells. MCF-7 cells were treated with chlorahololide D (7.5, 15, and 30 μM) for 48 h. (
Acknowledgments
This image is the copyrighted work of the attributed author or publisher, and
ZFIN has permission only to display this image to its users.
Additional permissions should be obtained from the applicable author or publisher of the image.
Full text @ Molecules