- Title
-
The splicing factor DHX38 enables retinal development through safeguarding genome integrity
- Authors
- Sun, K., Han, Y., Li, J., Yu, S., Huang, Y., Zhang, Y., Reilly, J., Tu, J., Gao, P., Jia, D., Chen, X., Hu, H., Ren, M., Li, P., Luo, J., Ren, X., Zhang, X., Shu, X., Liu, F., Liu, M., Tang, Z.
- Source
- Full text @ iScience
|
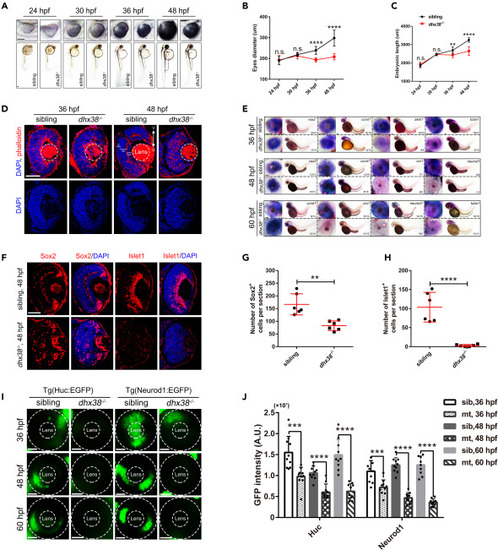
Dhx38 deletion impaired retinal morphology and RPC differentiation (A) The morphology of bodies and eyes in siblings and dhx38−/− embryos at 24, 30, 36, and 48 hpf. Scale bar, 100 μm. (B, C) Quantification of the embryonic length and eye size in siblings and dhx38−/− embryos shown in A. n = 10 for each panel. Data was shown as mean ± SD. n.s., no significance; ∗∗p < 0.01, ∗∗∗∗p < 0.0001 as indicated. (D) Retinal sections of siblings and dhx38 mutants were stained with phalloidin and DAPI at 36 and 48 hpf. V, ventral side, D, dorsal side. n = 9 for each panel. Scale bar, 50 μm. (E) Whole-mount in situ hybridization for RPCs marker (ccnd1 and vsx2), for neural precursors (atoh7 and crx1), and for specialized neurons (neurod1) and mature neurons (tuba1) at 36, 48 and 60 hpf. Scale bar, 100 μm. (F) Retinal sections of siblings and dhx38−/− embryos were immunostained using Sox2 (a marker for RPCs), and Islet1 (a marker for neuron cells) antibodies at 48 hpf. (G and H) Quantification of the Sox2+ and Islet1+ cells in the retinas of siblings and dhx38−/− embryos shown in F. n = 6 per panel. Scale bar, 50 μm. Data was shown as mean ± SD. ∗∗p < 0.01, ∗∗∗∗p < 0.0001 as indicated. (I) Distribution of Neurod1:EGFP (specialized neurons) and Huc:EGFP (post mitotic neurons) labeled cells in the whole retina of siblings and dhx38−/− transgenic zebrafish at 36, 48 and 60 hpf. The dashed circles indicate the eye and lens, respectively. Scale bar, 50 μm. (J) Quantification of the GFP intensity in the eyes of siblings and dhx38−/− embryos at different stages shown in I. n = 10 per panel. Data was shown as mean ± SD. ∗∗∗p < 0.001, ∗∗∗∗p < 0.0001 as indicated. |
|
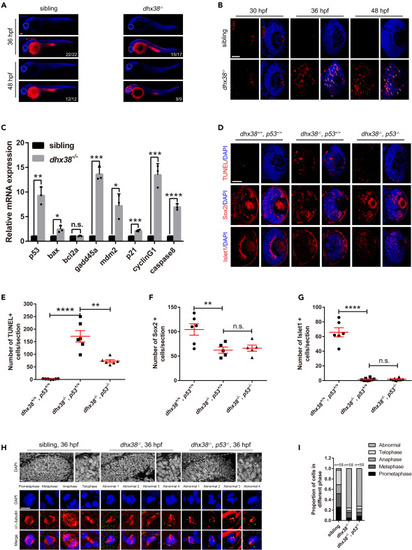
Dhx38 deletion leads to p53-dependent apoptosis and abnormal mitosis in zebrafish retinas (A) Whole embryo TUNEL staining showed many apoptotic cells in the retina, brain and spinal cord of dhx38 mutants at 36 and 48 hpf. White arrows, apoptotic signals. Scale bar, 100 μm. (B) Retinal sections showed many apoptotic signals at 30, 36 and 48 hpf in dhx38 mutant zebrafish retinas White arrows, apoptotic RPCs. n = 9 per panel; Scale bar, 50 μm. (C) qPCR showed activation of the p53 pathway in the dhx38 mutant at 36 hpf. Data was shown as mean ± SD. n.s., no significance; ∗p < 0.05, ∗∗p < 0.01, ∗∗∗p < 0.001, ∗∗∗∗p < 0.0001 as indicated. (D) p53 deletion in dhx38 mutants significantly reduces apoptosis of RPCs, but could not rescue retinal differentiation defects. 36 hpf for TUNEL; 48 hpf for Sox2 and Islet1. Scale bar, 50 μm. (E‒G) The quantitative analysis of TUNEL-positive cells, Sox2-positive cells and Islet1-positive cells is shown in D. n ≥ 5 per panel. Data was shown as mean ± SD. n.s., no significance; ∗∗p < 0.01, ∗∗∗∗p < 0.0001 as indicated. (H) The spindle and nuclei of RPCs in siblings, dhx38−/− and dhx38−/−/p53−/− zebrafish were stained using anti-α-tubulin (red) and γ-tubulin (green) antibodies and DAPI (blue), respectively. The different types of spindle abnormalities are shown in the panels (abnormal 1–4). Hexagon, mitotic karyotype. Scale bar, 10 μm. (I) Quantitative analysis of the number of RPCs at each stage of mitosis in siblings and dhx38 mutant embryos shown in (H). |
|
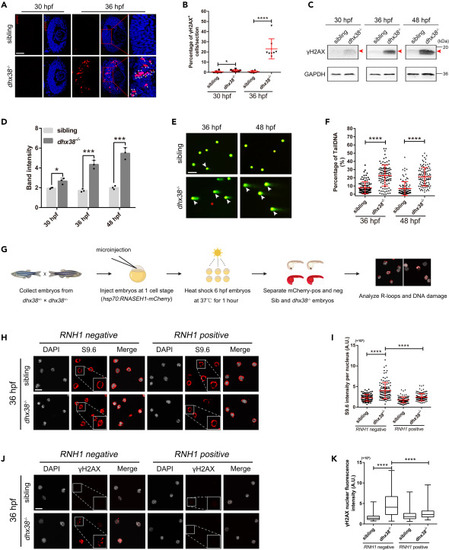
Dhx38 constraint of R-loop levels is critical for RPCs homeostasis (A) Immunofluorescence analysis of dhx38−/− and sibling retinas at 30 hpf and 36 hpf. Scale bar, 50 μm. (B) Quantitative analysis of the percentage of γH2AX-positive cells in each condition is shown in A. n = 8 per panel. Data was shown as mean ± SD. ∗p < 0.05, ∗∗∗∗p < 0.0001 as indicated. (C and D) The protein levels of γH2AX in siblings and dhx38 mutants at different time points were detected using Western blotting. GAPDH was used to normalize protein loading. The red arrows indicated the corresponding protein bands. Data was shown as mean ± SD. ∗p < 0.05, ∗∗∗p < 0.001 as indicated. (E) Alkaline comet assay showed increased DNA damage in dhx38 mutants at 36 hpf and 48 hpf. White arrows, DNA with single or double-strand breaks. Scale bar, 100 μm. (F) Quantitative analysis of the DNA damaged cells shown in D. At least 100 cells from 15 embryos were quantified per group. Data was shown as mean ± SD. ∗∗∗∗p < 0.0001 as indicated. (G) Schematic of the RNH1 overexpression experiments. (H and J) Confocal images showing the immunofluorescence of R-loops (H) and γH2AX (J) levels in cells isolated from siblings and dhx38 mutants that were either (hsp70:M27RNASEH1-mCherry) negative (left) or (hsp70:M27RNASEH1-mCherry) positive (right). Scale bar, 10 μm. (I and K) Quantification of R-loops (I) and γH2AX (K) levels in 15 embryos with at least 100 cells per group. Data was shown as mean ± SD. ∗∗∗∗p < 0.0001 as indicated. |
|
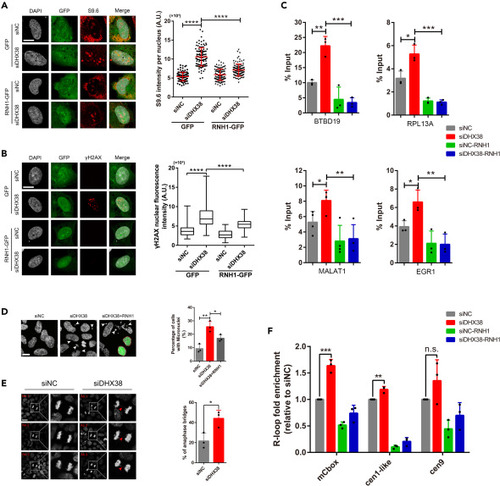
DHX38 depletion led to R-loop-dependent genome instability in human cells (A) Representative images and quantification of S9.6 staining per nucleus in ARPE-19 cells treated with siNC or siDHX38. Cells were transfected with either a control (GFP) or a vector expressing RNH1-GFP. At least 100 cells were calculated from three independent experiments. Scale bar, 10 μm. Data was shown as mean ± SD. ∗∗∗∗p < 0.0001 as indicated. (B) Immunofluorescence of γH2AX in ARPE-19 cells after siNC and siDHX38 transfection with or without RNH1-GFP overexpression. At least 100 cells were calculated from three independent experiments. Scale bar, 10 μm. Data was shown as mean ± SD. ∗∗∗∗p < 0.0001 as indicated. (C) DRIP-qPCR using the S9.6 antibody for the genes BTBD19, RPL13A, MALAT1 and EGR1 in HEK293 cells after being transfected with the indicated siRNAs. The relative abundance of RNA: DNA hybrids immunoprecipitated was represented as a percentage of the input material. Data was shown as mean ± SD. ∗p < 0.05, ∗∗p < 0.01, ∗∗∗p < 0.001 as indicated. (D) Representative images of DHX38-depleted HEK293 cells showing micronuclei (white arrows). Dotted line, cells transfected with RNH1-GFP. Scale bar, 10 μm. Data was shown as mean ± SD. ∗p < 0.05, ∗∗p < 0.01 as indicated. (E) Anaphase bridges (red arrows) in siNC and siDHX38 transfected HEK293 cells. Microphotographs showing anaphase bridges in DHX38-depleted cells. The percentages of anaphase cells with anaphase bridges were plotted. No, normal; Ab, anaphase bridges. Scale bar, 20 μm. Data was shown as mean ± SD. ∗p < 0.05 as indicated. (F) Detected R-loop levels using DRIP-qPCR assay on specific centromeric α-SAT arrays (mCbox, cen1-like, and cen9) in siNC and siDHX38 cells. Graph shows the R-loop fold enrichment normalized to control (siNC) conditions. Data was shown as mean ± SD. n.s., no significance; ∗∗p < 0.01, ∗∗∗p < 0.001 as indicated. |
|
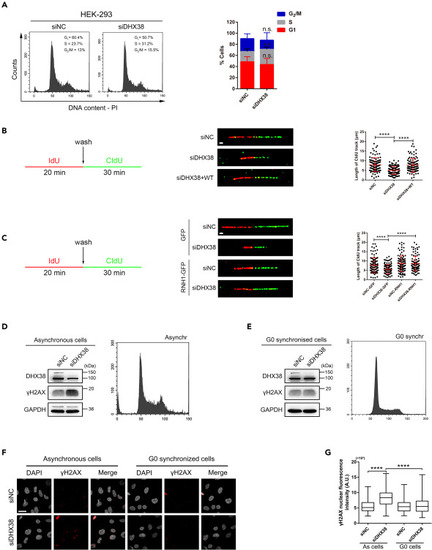
DHX38 inhibition slowed down ongoing DNA synthesis and caused cell-cycle arrest (A) FACS analysis of PI (propidium iodide) staining in HEK293 cells treated with either control siNC or siDHX38. N = 4 separate experiments. Data was shown as mean ± SD. n.s., no significance; ∗∗p < 0.01 as indicated. (B and C) The experimental scheme of DNA fiber assay (left) and representative DNA fibers from the identified conditions (middle), quantified by CldU track length (right). For each condition the lengths of the CIdU tracks of n ≥ 100 fibers were quantified. Scale bar, 3 μm. Data was shown as mean ± SD. ∗∗∗∗p < 0.0001 as indicated. (D and E) Left: Western blotting of total HEK293 cell extracts upon asynchronously growing (D) or serum starvation (E) after DHX38 knockdown. Cell cycle distribution was verified using FACS analysis (right panel). (F and G) Immunofluorescence images of γH2AX fluorescence in asynchronously growing or serum starvation HEK293 cells after DHX38 knockdown. Quantification of at least 100 cells from three independent experiments. Scale bar, 30 μm. Data was shown as mean ± SD. ∗∗∗∗p < 0.0001 as indicated. |

