Fig. 4
- ID
- ZDB-FIG-240130-46
- Publication
- Sun et al., 2023 - The splicing factor DHX38 enables retinal development through safeguarding genome integrity
- Other Figures
- All Figure Page
- Back to All Figure Page
|
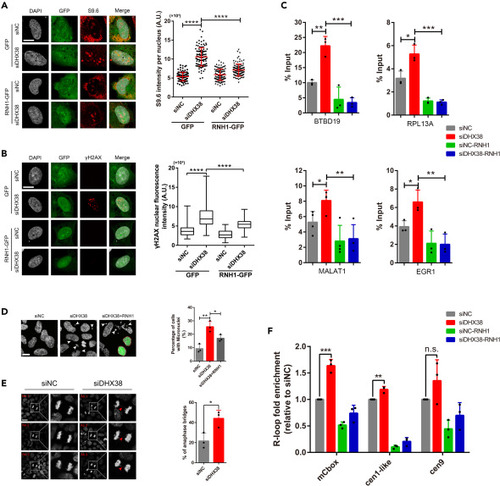
DHX38 depletion led to R-loop-dependent genome instability in human cells (A) Representative images and quantification of S9.6 staining per nucleus in ARPE-19 cells treated with siNC or siDHX38. Cells were transfected with either a control (GFP) or a vector expressing RNH1-GFP. At least 100 cells were calculated from three independent experiments. Scale bar, 10 μm. Data was shown as mean ± SD. ∗∗∗∗p < 0.0001 as indicated. (B) Immunofluorescence of γH2AX in ARPE-19 cells after siNC and siDHX38 transfection with or without RNH1-GFP overexpression. At least 100 cells were calculated from three independent experiments. Scale bar, 10 μm. Data was shown as mean ± SD. ∗∗∗∗p < 0.0001 as indicated. (C) DRIP-qPCR using the S9.6 antibody for the genes BTBD19, RPL13A, MALAT1 and EGR1 in HEK293 cells after being transfected with the indicated siRNAs. The relative abundance of RNA: DNA hybrids immunoprecipitated was represented as a percentage of the input material. Data was shown as mean ± SD. ∗p < 0.05, ∗∗p < 0.01, ∗∗∗p < 0.001 as indicated. (D) Representative images of DHX38-depleted HEK293 cells showing micronuclei (white arrows). Dotted line, cells transfected with RNH1-GFP. Scale bar, 10 μm. Data was shown as mean ± SD. ∗p < 0.05, ∗∗p < 0.01 as indicated. (E) Anaphase bridges (red arrows) in siNC and siDHX38 transfected HEK293 cells. Microphotographs showing anaphase bridges in DHX38-depleted cells. The percentages of anaphase cells with anaphase bridges were plotted. No, normal; Ab, anaphase bridges. Scale bar, 20 μm. Data was shown as mean ± SD. ∗p < 0.05 as indicated. (F) Detected R-loop levels using DRIP-qPCR assay on specific centromeric α-SAT arrays (mCbox, cen1-like, and cen9) in siNC and siDHX38 cells. Graph shows the R-loop fold enrichment normalized to control (siNC) conditions. Data was shown as mean ± SD. n.s., no significance; ∗∗p < 0.01, ∗∗∗p < 0.001 as indicated. |

