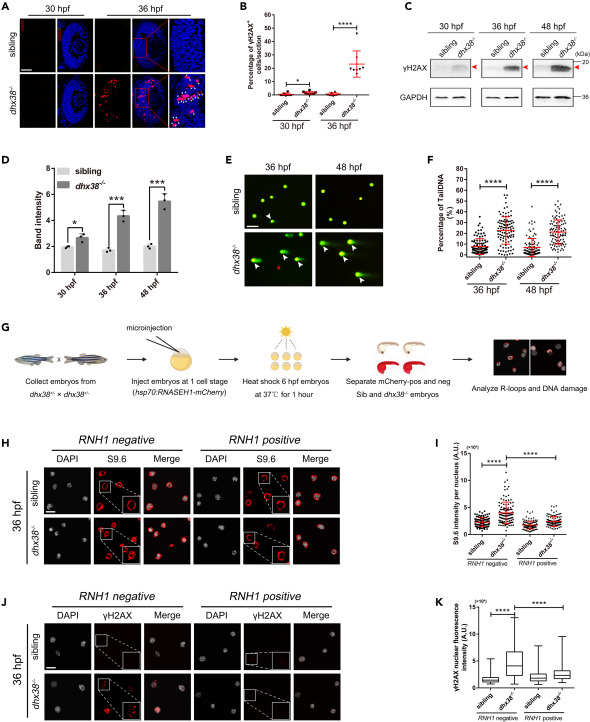
Fig. 3 Dhx38 constraint of R-loop levels is critical for RPCs homeostasis (A) Immunofluorescence analysis of dhx38−/− and sibling retinas at 30 hpf and 36 hpf. Scale bar, 50 μm. (B) Quantitative analysis of the percentage of γH2AX-positive cells in each condition is shown in A. n = 8 per panel. Data was shown as mean ± SD. ∗p < 0.05, ∗∗∗∗p < 0.0001 as indicated. (C and D) The protein levels of γH2AX in siblings and dhx38 mutants at different time points were detected using Western blotting. GAPDH was used to normalize protein loading. The red arrows indicated the corresponding protein bands. Data was shown as mean ± SD. ∗p < 0.05, ∗∗∗p < 0.001 as indicated. (E) Alkaline comet assay showed increased DNA damage in dhx38 mutants at 36 hpf and 48 hpf. White arrows, DNA with single or double-strand breaks. Scale bar, 100 μm. (F) Quantitative analysis of the DNA damaged cells shown in D. At least 100 cells from 15 embryos were quantified per group. Data was shown as mean ± SD. ∗∗∗∗p < 0.0001 as indicated. (G) Schematic of the RNH1 overexpression experiments. (H and J) Confocal images showing the immunofluorescence of R-loops (H) and γH2AX (J) levels in cells isolated from siblings and dhx38 mutants that were either (hsp70:M27RNASEH1-mCherry) negative (left) or (hsp70:M27RNASEH1-mCherry) positive (right). Scale bar, 10 μm. (I and K) Quantification of R-loops (I) and γH2AX (K) levels in 15 embryos with at least 100 cells per group. Data was shown as mean ± SD. ∗∗∗∗p < 0.0001 as indicated.
Image
Figure Caption
Acknowledgments
This image is the copyrighted work of the attributed author or publisher, and
ZFIN has permission only to display this image to its users.
Additional permissions should be obtained from the applicable author or publisher of the image.
Full text @ iScience

