FIGURE SUMMARY
Title

Identification of side effects of COVID-19 drug candidates on embryogenesis using an integrated zebrafish screening platform

Authors
Ernst, A., Piragyte, I., Mp, A.M., Le, N.D., Grandgirard, D., Leib, S.L., Oates, A., Mercader, N.
Source
Full text @ Sci. Rep.

Overview of drugs included in zebrafish cardiovascular and behavioral screening setup. (a) Information on type of candidate drugs used. All primary drug indications are listed and a set of anti-infective agents is shown. (b) A representative table of drugs that are FDA-approved or in III Clinical trial with the indicated Cmax blood concentrations and risk during pregnancy.

Schematic representation of the experimental workflow. (a) Tg(fli1:EGFP);(myl7:mRFP) embryos were used for the morphological assay (green: cytoplasmic GFP in endothelium; magenta: membrane RFP in cardiomyocytes). After drug treatment, between 96 and 104 hpf, the anesthetized larvae were transferred to 96 well plates with pre-formed agarose beds by a 3D printed mold. This is followed by image acquisition. Treated larvae positioned in a 96 well plate are imaged using a Smart Imaging Wide field Fluorescent Microscope Platform. (b) Image analysis. (1) Image analysis through a semiautomatic and blinded workflow based on a Fiji-macro. (2) To count the intersegmental vessels (ISV) the user draws a line (red line) along all ISVs. A kymograph along the Z-axis allows detection of local maxima. (3) The larval length from anterior to posterior (AP) is measured by drawing a line from the most anterior of the head to the most posterior of the tail. (4) Effusions are identified as shown in the examples. (5) For heartbeat measurements, hearts are detected with an automated threshold to generate a mask and a kymograph along the time axis detects the local maxima. For the deep learning-based analysis, image data of the ISV and the heart are manually annotated. The annotated data are used to train two different U-Net models. The ISV-Seg model is applied to segment each ISV and calculate the area. The Heart-Seg model is used to segment ventricle and atrium. The minima and maxima of the ventricular area along the time axis are used to calculate the ejection fraction. For the behavioral assay, wild type larvae were treated with the drugs and transferred to 96 well plates. The swimming of larvae with a defined light–dark exposure was recorded and the tracking data exported. (c) The results are collected and used for meta-analysis with Python. The results were presented as heat maps and in a customized online Streamlit data app.

Summary of results obtained for the compounds screening. (a) Bar plot representing the percentage of mortality and pericardial effusion of embryos tested in morphological assay. (b) Bar plot representing percentage of compounds leading to statistically significant alterations in the analyzed parameters. (c) Heat map of the results obtained for the tested compounds. Compound names are listed on the right of the heat map and are allocated to groups: ΔHeart, ΔBody length, ΔVasculature, ΔActivity or “No significant effect”, depending on the results. E.g. a compound that led to high reduction of ejection fraction compared to controls would appear in the group ΔHeart. The formula used to calculate the scores in the heatmap is given at the bottom. The p-value is derived from the Mann–Whitney U test treatment vs. control, the lower the p-value the higher the –log10(p-value). The hedge’s effect size gives an estimation of how strong an effect is. The fold change (FC) shows whether the values are higher or lower than the control and how many times compared to the control. The scores are shown in a relative color scale: green, most positive score; magenta, most negative score; grey, no significance using a Mann–Whitney U test. Shown are the mean values from at least two technical replicates, each replicate is composed of at least 10 embryos per condition. o symbol indicates novel statistically significant observations in behavioral assay. All the compounds are used at 1 μM except when it is mentioned otherwise. Asterisk in Ivermectin refers to the fact that it was used at 1 μM for the morphological assay and at 0.5 μM for the behavioral assay. Compounds mentioned throughout the manuscript are highlighted in bold.

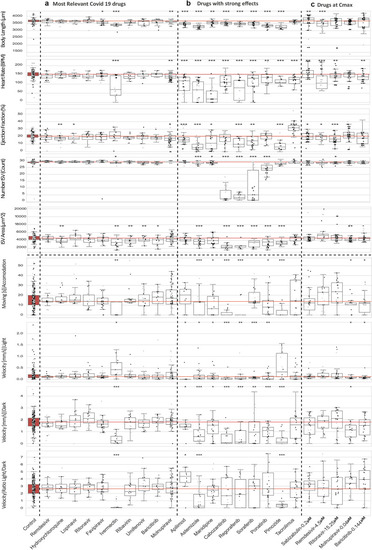
Combined boxplots and swarmplots showing the morphology and activity measurements for each larva. (a) Results from treatments using drugs studied in the context of Covid-19 research. (b) Results from treatments leading to strongest phenotypic alterations. (c) Results from treatments using COVID-19 drugs used at Cmax. The asterisks represent the p-values from the Mann–Whitney U test * < 0.05; ** < 0.01;*** < 0.001. Results from control larvae highlighted with red fill color. The red line indicates the median of the control as reference for treatment conditions. The plots are shown for all performed measurements.

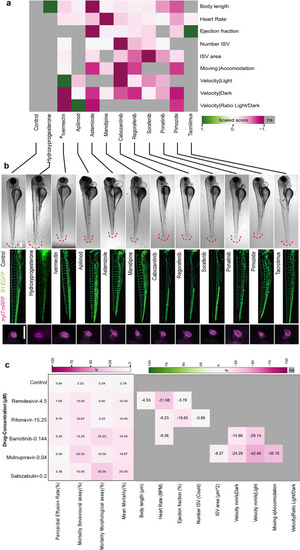
Selection of specific compounds eliciting effects on zebrafish embryonic development. (a) Results of 11 drug treatments leading to strong phenotypic alterations. Heatmap showing the highest positive score in dark green and the lowest negative score in dark magenta. Each measurement is individually scaled. Grey color indicates no significance according to the Mann–Whitney U test. Shown are the mean values from at least two technical replicates, each replicate is composed of at least 10 embryos per condition. Boxplots with individual data points for the morphology assay can be found in Fig. 4. (b) Example images of the control and treatments with visible effects are shown in brightfield, vasculature Tg(fli1:EGFP) and heart Tg(myl7:mRFP). Brightfield and GFP images are shown as sobel-projections. The dynamic range of GFP images was homogenized using the DEVILS Fiji-plugin. Scale bars: 250 μm. (c) Selected compounds at clinically relevant concentrations result in mild modulation of embryonic. A heatmap (left) showing percentage of pericardial effusion and mortality of the selected drugs at their clinically relevant concentrations. Mortality rates for morphological assay (with PTU) and behavioral assay (without PTU) are plotted separately followed by a column of mean mortality rate. Dark magenta shows the highest effect. The relative percentage effect of these selected drugs at their clinically relevant concentrations are shown in the heatmap (right). The highest positive effect is shown in dark green and the lowest negative effect is dark magenta. Grey color indicates no significance according to the Mann–Whitney U test. Shown are the percentage from median values from at three technical replicates for drugs except for Remdesivir, that was tested in two replicates, each replicate is composed of at least 10 embryos per condition during drug treatment.

qPCR results for inflammation associated gene expression in zebrafish larvae (a) Scheme of larvae treatment with SARS-CoV-2 spike protein and selected drugs. (b) qPCR results for zebrafish larvae treated with SPIKE protein. (c) qPCR results represented as a heatmap representing fold change with respect to treatment with DMSO without spike (− SPIKE + DMSO). The upregulation is shown in dark green and the downregulation in dark magenta. Significance calculated between DMSO with SPIKE-protein treated group (+ SPIKE + DMSO) and the rest. Each color box represents a mean of 6 biological replicates of 5 embryo pools (n = 6, Mann–Whitney U-test treatment vs. + spike + DMSO; *p < 0.05, **p < 0.01, ***p < 0.001).

Remdesivir, Ritonavir, Molnupiravir, Baricitinib or Sabizabulin alter the inflammatory gene response in the absence of spike protein. qPCR results for inflammation associated gene expression in zebrafish larvae treaded with selected compounds. Remdesivir, Ritonavir, Molnupiravir, Baricitinib or Sabizabulin treatment is compared to larvae treated with DMSO. Bars represent mean and SD of 6 biological replicates. Each replicate consists of a pool of 5 larvae. Asterisks represent p-values from the Mann–Whitney U test * < 0.05; ** < 0.01;*** < 0.001. Note that in all graphs the same DMSO control samples were used.

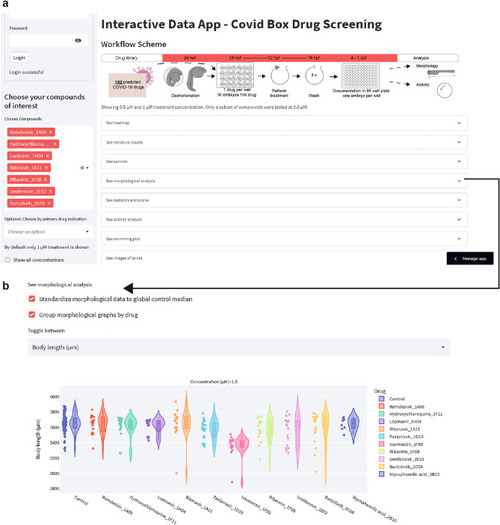
Generation of a Web-based Data App. (a) The data app overview window shows which information can be found in the app. A heatmap with the previously described scores, results of the literature search, survival data, morphological analysis, activity analysis and images of the larvae. (b) Example tab opened, showing interactive violin plots for the larval length, which allows to see the distribution and individual data points. The checkboxes allow to view the corrected or raw data batch, and replicates can be grouped or shown individually. https://share.streamlit.io/alernst/covasc_dataapp/main/CoVasc_DataApp.py.

Acknowledgments
This image is the copyrighted work of the attributed author or publisher, and ZFIN has permission only to display this image to its users. Additional permissions should be obtained from the applicable author or publisher of the image. Full text @ Sci. Rep.