IMAGE

Figure 6

ID
ZDB-IMAGE-231011-8
Source
Figures for Ernst et al., 2023
Image
Figure Caption

Figure 6

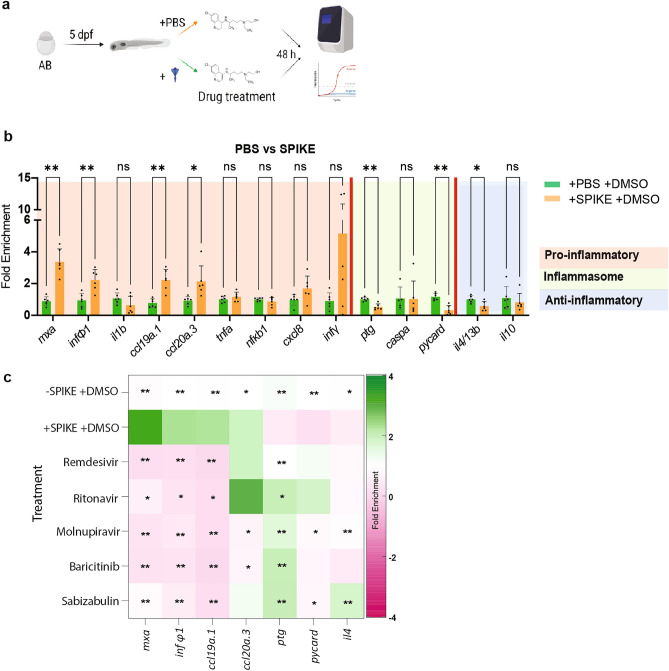
qPCR results for inflammation associated gene expression in zebrafish larvae (a) Scheme of larvae treatment with SARS-CoV-2 spike protein and selected drugs. (b) qPCR results for zebrafish larvae treated with SPIKE protein. (c) qPCR results represented as a heatmap representing fold change with respect to treatment with DMSO without spike (− SPIKE + DMSO). The upregulation is shown in dark green and the downregulation in dark magenta. Significance calculated between DMSO with SPIKE-protein treated group (+ SPIKE + DMSO) and the rest. Each color box represents a mean of 6 biological replicates of 5 embryo pools (n = 6, Mann–Whitney U-test treatment vs. + spike + DMSO; *p < 0.05, **p < 0.01, ***p < 0.001).

Acknowledgments
This image is the copyrighted work of the attributed author or publisher, and ZFIN has permission only to display this image to its users. Additional permissions should be obtained from the applicable author or publisher of the image. Full text @ Sci. Rep.