IMAGE

Figure 4

ID
ZDB-IMAGE-231011-6
Source
Figures for Ernst et al., 2023
Image
Figure Caption

Figure 4

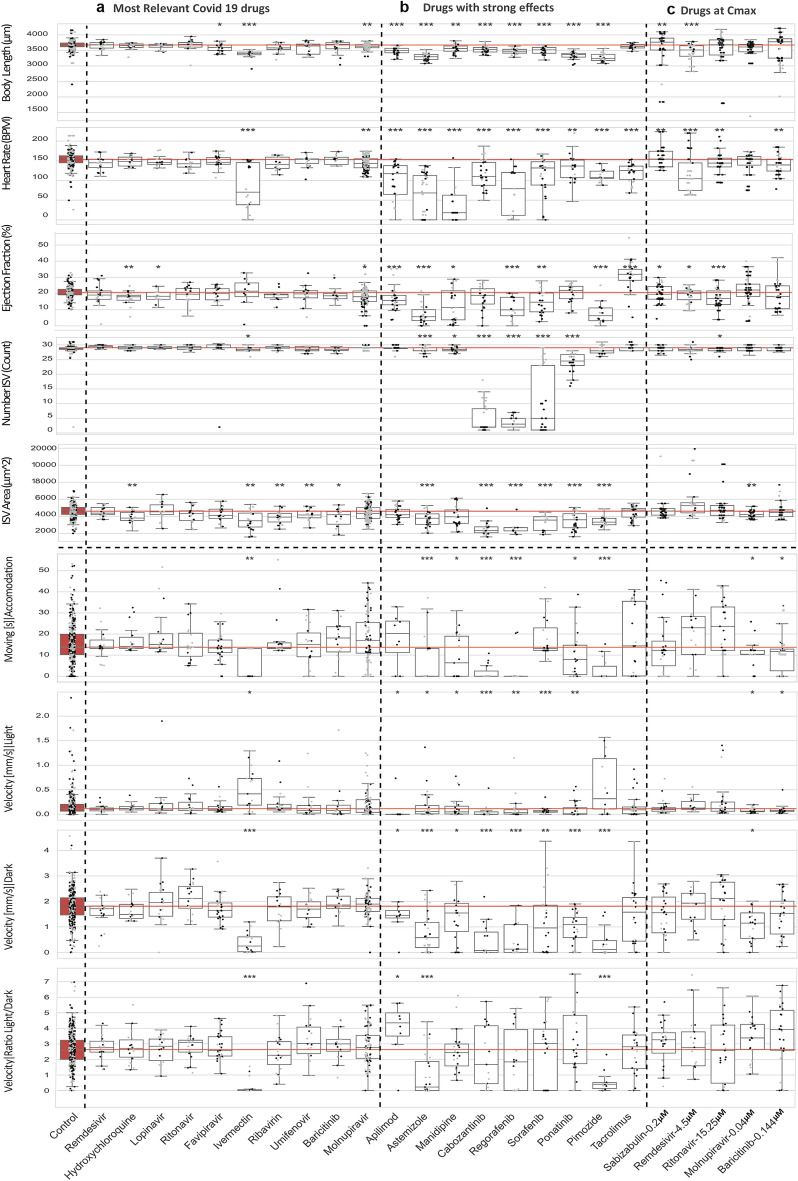
Combined boxplots and swarmplots showing the morphology and activity measurements for each larva. (a) Results from treatments using drugs studied in the context of Covid-19 research. (b) Results from treatments leading to strongest phenotypic alterations. (c) Results from treatments using COVID-19 drugs used at Cmax. The asterisks represent the p-values from the Mann–Whitney U test * < 0.05; ** < 0.01;*** < 0.001. Results from control larvae highlighted with red fill color. The red line indicates the median of the control as reference for treatment conditions. The plots are shown for all performed measurements.

Acknowledgments
This image is the copyrighted work of the attributed author or publisher, and ZFIN has permission only to display this image to its users. Additional permissions should be obtained from the applicable author or publisher of the image. Full text @ Sci. Rep.