IMAGE

Figure 3

ID
ZDB-IMAGE-231011-5
Source
Figures for Ernst et al., 2023
Image
Figure Caption

Figure 3

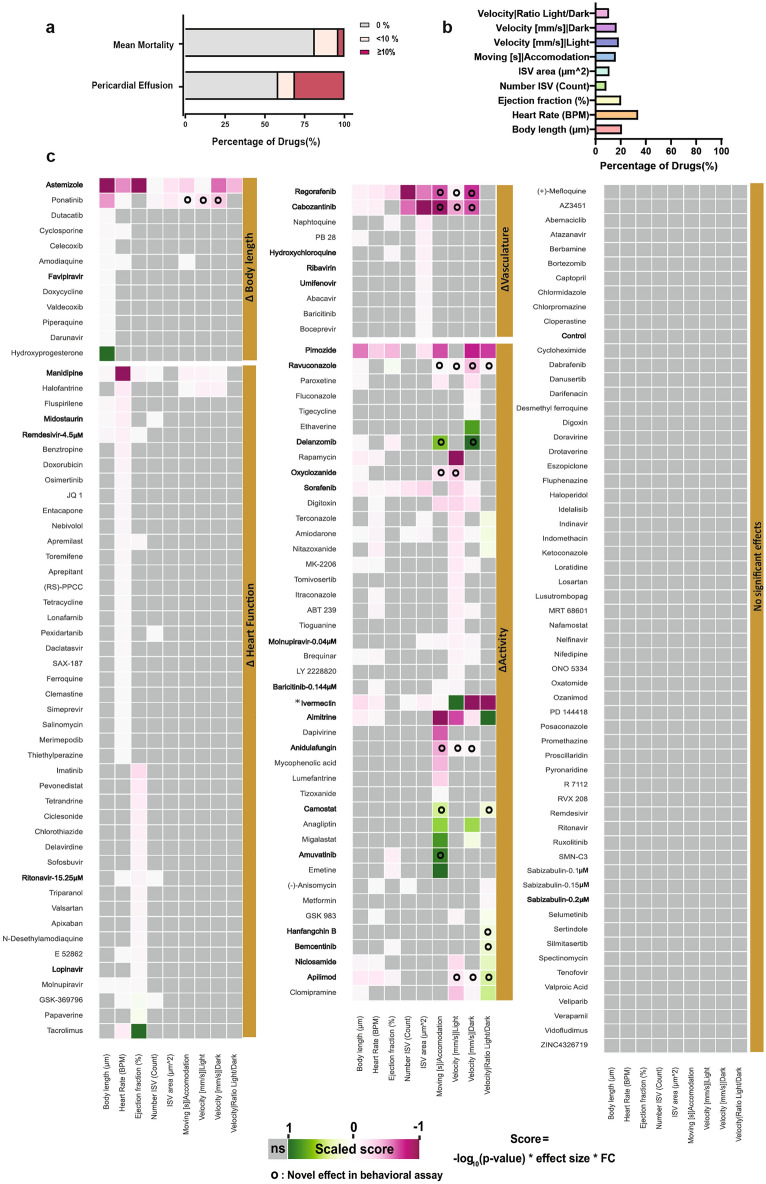
Summary of results obtained for the compounds screening. (a) Bar plot representing the percentage of mortality and pericardial effusion of embryos tested in morphological assay. (b) Bar plot representing percentage of compounds leading to statistically significant alterations in the analyzed parameters. (c) Heat map of the results obtained for the tested compounds. Compound names are listed on the right of the heat map and are allocated to groups: ΔHeart, ΔBody length, ΔVasculature, ΔActivity or “No significant effect”, depending on the results. E.g. a compound that led to high reduction of ejection fraction compared to controls would appear in the group ΔHeart. The formula used to calculate the scores in the heatmap is given at the bottom. The p-value is derived from the Mann–Whitney U test treatment vs. control, the lower the p-value the higher the –log10(p-value). The hedge’s effect size gives an estimation of how strong an effect is. The fold change (FC) shows whether the values are higher or lower than the control and how many times compared to the control. The scores are shown in a relative color scale: green, most positive score; magenta, most negative score; grey, no significance using a Mann–Whitney U test. Shown are the mean values from at least two technical replicates, each replicate is composed of at least 10 embryos per condition. o symbol indicates novel statistically significant observations in behavioral assay. All the compounds are used at 1 μM except when it is mentioned otherwise. Asterisk in Ivermectin refers to the fact that it was used at 1 μM for the morphological assay and at 0.5 μM for the behavioral assay. Compounds mentioned throughout the manuscript are highlighted in bold.

Acknowledgments
This image is the copyrighted work of the attributed author or publisher, and ZFIN has permission only to display this image to its users. Additional permissions should be obtained from the applicable author or publisher of the image. Full text @ Sci. Rep.