
- Title
-
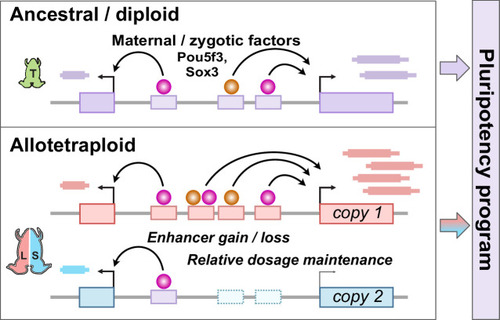
Hybridization led to a rewired pluripotency network in the allotetraploid Xenopus laevis
- Authors
- Phelps, W.A., Hurton, M.D., Ayers, T.N., Carlson, A.E., Rosenbaum, J.C., Lee, M.T.
- Source
- Full text @ Elife
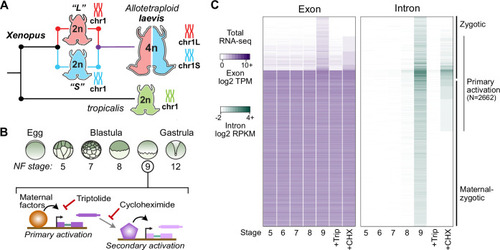
The allotetraploid X. laevis genome contains two distinct subgenomes “L” and “S” due to interspecific hybridization of ancestral diploids. (B) Triptolide inhibits genome activation, as measured in the late blastula, while cycloheximide inhibits only secondary activation, distinguishing genes directly activated by maternal factors. NF = Nieuwkoop and Faber. (C) Heatmap of RNA-seq coverage over exons (left) and introns (right) of activated genes. |

( |

( |

Proportion of genes activated only from one homeolog or from both homeologs at stage 8, as compared to their homeolog activation patterns at stage 9. (B) Biplots showing L dominant (red) or S dominant (blue) activation at stage 8 (left), that resolves to more balanced homeolog activation patterns at stage 9. Each gene is the same color in both plots. (C) Biplot comparing log2 fold all stage 9 activation over triptolide treated embryos for the S homeolog (x axis) versus the L homeolog. (D) Proportion of genes activated symmetrically or asymmetrically from the L or S subgenomes, stratified into whether there is a maternal contribution for either homeolog (MZ) or not (Z), for primary activated genes, all stage 9 activated genes, and stage 10.5 activated genes. p Values are from χ-squared tests, 4 d.o.f. (E) Proportion of genes activated symmetrically or asymmetrically from the L or S subgenomes from stages 10–13 in differentiated lineages. Top plots represent all genes increased at each stage, bottom plots represent genes with maternal contribution <1 TPM. Lineage-specific gene expression data are from Johnson et al., 2022. (F) Proportion of genes encoded on both subgenomes that change homeolog activation patterns in a differentiated lineage in stages 10–13. (G) Concordance of homeolog activation patterns across the differentiated lineages at stages 10–13, for all genes up in at least two different lineages (top) or only genes with maternal contribution <1 TPM (bottom). (H) Boxplots showing log2 L versus S expression ratio for each differentiated lineage over stages 10–13, in the whole transcriptome. N = 8271 homeolog pairs. (I) Zoom of boxplots in (H), demonstrating a gradual bias toward L-dominant expression over time. (J) Significantly (FDR <0.05, Fisher’s exact test, two-sided) enriched Gene Ontology terms in genes activated from both homeologs, as compared to genes activated from only one subgenome. (K) Boxplots of non-synonymous to synonymous substitution rate ratio (dN/dS) shown on a log10 scale, for genes activated from both subgenomes or only one subgenome (p=0.15, Kruskal-Wallis test; median L=0.15, LS = 0.14, S=0.14). All gene groups trend toward stabilizing selection. N = 465, 585, 305 for L, L+S, and S groups, respectively. (L) Boxplots of CDS percent similarity for activation groups as in (K) (p=0.23, Kruskal-Wallis test). For all boxplots: center line, median; box limits, upper and lower quartiles; whiskers, 1.5x interquartile range; points, outliers. |
( |

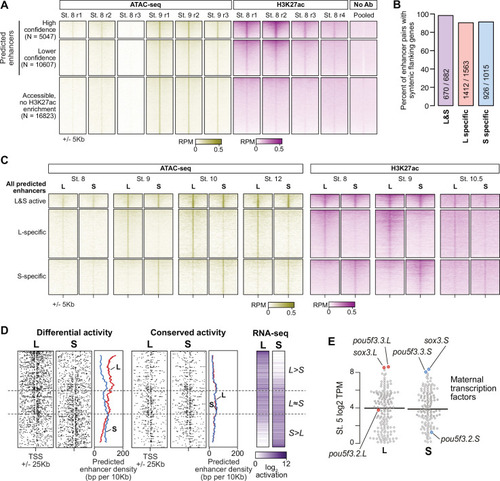
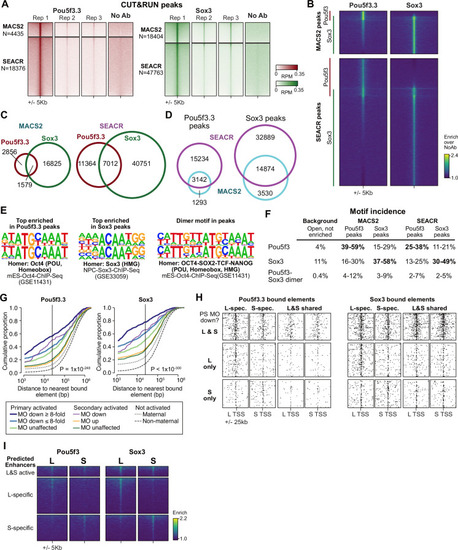
(A) CUT&RUN coverage over all annotated transcription-start site (TSS) regions, sorted by descending stage 8 H3K27ac signal. (B) Bee-swarm plots showing the log2 ratio of L versus S homeolog coverage among genes where only one homeolog is activated (L only, S only), or both homeologs are activated. TSS region is 1 kb centered on the TSS; upstream region is 500 bp to 3 kb upstream of the TSS. Horizontal bars show medians. Individual category p values are from two-sided paired t-tests of log2 L homeolog coverage vs log2 S homeolog coverage, p values across the three categories are from a one-way ANOVA on the log2 ratios. (C) Stage 9 H3K4me3 CUT&RUN coverage over paired homeologous gene regions around the TSS (left) and maps comparing high-confidence predicted enhancer density near homeologous TSSs (middle). Differential predicted enhancers are active in only one subgenome, conserved predicted enhancers are active in both. Average densities are plotted to the right of each paired map. Gene pairs are sorted according to L versus S subgenome RNA-seq activation ratio (right). (D) Schematics showing aligned predicted enhancers and their homeologous regions (gray) mapped onto L (red, top lines) and S (blue, bottom lines) chromosomes. Comparable schematics show Xenbase annotated homeologous gene pairs (lavender). (E) Heatmap of stage 9 ATAC-seq and stage 8 H3K27ac CUT&RUN over L & S homeologous regions for equivalently active high-confidence predicted enhancers (top) and subgenome-specific predicted enhancers. (F) Top enriched transcription factor motif families in L-specific and S-specific active high-confidence predicted enhancers compared to inactive homeologous regions. FDR-corrected p-values from Homer are shown. RPM = reads per million. |

( |
( |

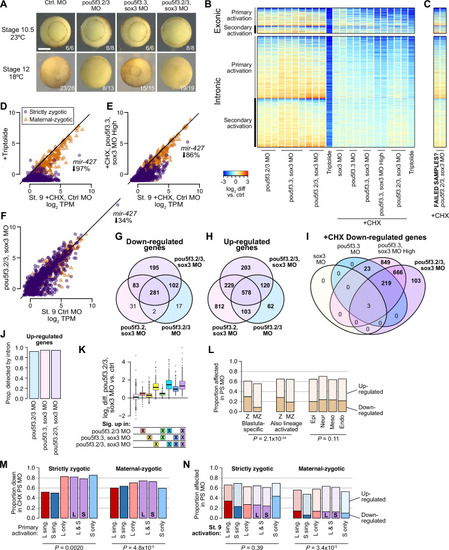
(A) Heatmap showing log2 fold activation differences for exonic and intronic regions of primary-activated genes for combinations of pou5f3.2, pou5f3.3, and sox3 morpholino-treatments, or Triptolide treatment, compared to controls. Right panel is in the presence of cycloheximide (CHX). (B) Biplot comparing exonic expression levels in cycloheximide-treated control embryos versus embryos also injected with pou5f3.2, pou5f3.3, and sox3 morpholinos. Primary-activated genes with maternal contribution <1 TPM (strictly zygotic) are purple circles, maternal-zygotic genes detected by exonic increases are orange triangles. TPM = transcripts per million. (C) Barplot summarizing the proportion of genes affected by morpholino treatment with cycloheximide on primary-activated genes (left bar), without cycloheximide (middle bar), and all stage 9 activated genes without cycloheximide (right bar). Down = significantly decreased in one of the morpholino treatments, up = significantly increased. (D, F) Biplots showing genes with >2 fold L or S biased activation (upper red and lower blue points, respectively) in control embryos (left panel) versus their activation in pou5f3.2, pou5f3.3, and sox3 morpholino-treated embryos (right panel, maintaining the same color per gene). (E, G) Quantification of the biplots in (D, F) in before-and-after plots. Y-axis is the absolute value of the log2 L vs S activation difference. p Values are from Wilcoxon signed-rank tests (paired). Overlaid boxplots show median, upper and lower quartiles, and 1.5 x interquartile range. (H) Regulatory networks consistent with direct regulation of embryonic gene activation by Pou5f3 and Sox3 (1) versus additional regulation by zygotic factors (2), which likely accounts for genes up-regulated in MO treatments. (I) Stage 8 Pou5f3.3 (left) and Sox3 (right) CUT&RUN coverage near TSSs for genes down-regulated in morpholino-treated embryos with or without cycloheximide (top), genes up-regulated (middle), and genes not significantly affected in any morpholino treatment (bottom). Top enriched motifs for each factor are shown below with p-values from Homer de novo discovery. (J) Aggregate plots of the binding signal in (I), with down-regulated genes further separated into genes down-regulated with morpholino treatment and cycloheximide (1°) or only down-regulated without cycloheximide (2°). p Values are from Kruskal-Wallis tests on summed signal per TSS. (K) Cumulative distributions of distance from a Pou5f3/Sox3-bound regulatory element for genes strongly (≥8 fold) and less strongly (<8 fold) down-regulated in morpholino-treated embryos with or without cycloheximide, compared to up-regulated, unaffected and unactivated genes. p Value is from a Kruskal-Wallis test. (L) Maps showing density of Pou5f3/Sox3-bound regulatory elements around paired homeologous TSSs, divided into elements with differential homeologous L & S binding (left panels) versus both bound (right panels). TSSs are grouped according to L versus S homeolog sensitivity to morpholino treatment. (M) Browser tracks showing CUT&RUN enrichment and ATAC-seq coverage near active homeolog hes3.L and inactive homeolog hes3.S. Seven L-specific high-confidence regulatory regions are highlighted with their homeologous S regions (bold ‘L’), as well as two lower-confidence enhancers, one of which also has weak activity in S, but minimal Pou5f3 or Sox3 binding (labeled ‘LS’). |
( |
( |

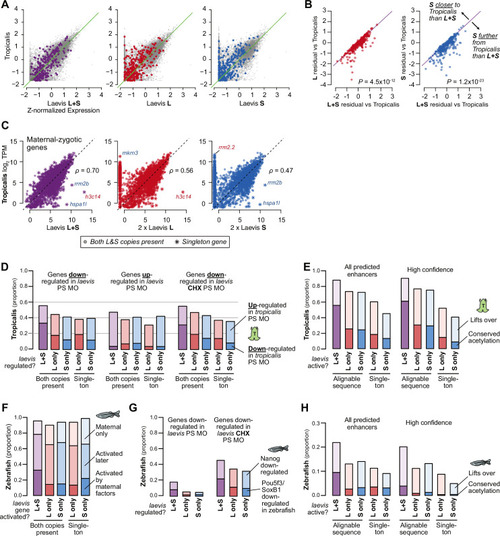
(A) Biplots comparing relative expression levels of activated genes in X. laevis and X. tropicalis, treating L and S homeolog contributions separately (middle, right) or summed (left). Individual subgenome expression is scaled 2 x, since transcript per million (TPM) normalization is calculated relative to the entire X. laevis transcriptome. Individual labeled genes are color coded according to the dominant expressed homeolog (red = L, blue = S, purple = equivalent). (B) Barplots showing the proportion of X. laevis genes across homeolog activation categories whose orthologs are also activated in X. tropicalis or part of the maternal contribution. (C) Barplots showing the proportion of X. laevis enhancers across homeolog activity categories that are acetylated in X. tropicalis. (D) Barplots showing the proportion of Xenopus genes whose orthologs are regulated by Pou5f3/SoxB1 and Nanog in zebrafish. Xenopus genes are classified according to how many homeo/orthologs are regulated by Pou5f3/Sox3. Genes with conserved regulation in both X. laevis homeologs and X. tropicalis are more likely to be regulated by Pou5f3/SoxB1 in zebrafish, but also more likely to be regulated by Nanog. |
( |
|