
Figure 3—figure supplement 2.
- ID
- ZDB-FIG-231013-27
- Publication
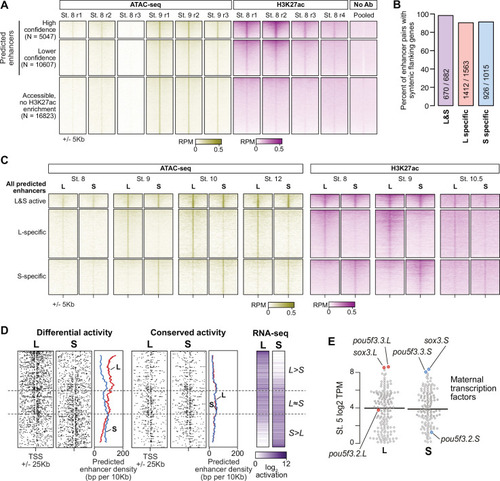
- Phelps et al., 2023 - Hybridization led to a rewired pluripotency network in the allotetraploid Xenopus laevis
- Other Figures
-
- Figure 1—figure supplement 1.
- Figure 1—figure supplement 1.
- Figure 2—figure supplement 1.
- Figure 2—figure supplement 1.
- Figure 2—figure supplement 2.
- Figure 3—figure supplement 1.
- Figure 3—figure supplement 1.
- Figure 3—figure supplement 2.
- Figure 4—figure supplement 1.
- Figure 4—figure supplement 1.
- Figure 4—figure supplement 2.
- Figure 5—figure supplement 1.
- Figure 5—figure supplement 1.
- Figure 6.
- All Figure Page
- Back to All Figure Page
( |