|
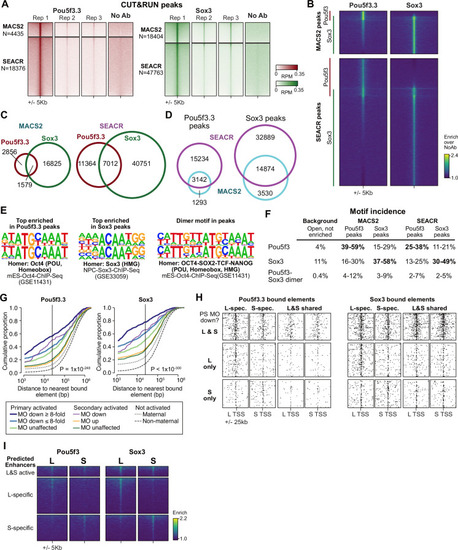
Pou5f3 and Sox3 CUT&RUN.(A) Heatmaps of Pou5f3.3 and Sox3 CUT&RUN coverage over MACS2 and SEACR predicted peaks, in each of the replicates and no-antibody samples. (B) Heatmaps of enrichment over no antibody (NoAb) at the union of peaks per method for pooled Pou5f3 and Sox3 CUT&RUN samples. Pou5f3 enrichment is observed across many of the Sox3 peaks, suggesting that both methods are under-calling Pou5f3 peaks. (C) Venn diagrams showing peak overlap between factors for MACS2 and SEACR. (D) Venn diagrams showing peak overlap between methods. (E) Top enriched motif for Homer de novo motif finding among the top 1000 MACS2 peaks for Pou5f3 (left) and Sox3 (middle) compared to the closest database match. The Pou5f3-Sox3 dimer motif (right) was predicted using a subset of Pou5f3 and Sox3 peaks with adjacent motif locations. (F) Table of occurrence of Homer database Oct4, Sox3, and Oct4-Sox2 dimer motifs among the peaks. The range indicates proportion of highly-centralized motifs (+/-50 bp from the summit) versus in a wider window (+/-100 bp). Dimer proportions are conservative and additionally require matches to each of the monomer Oct4 and Sox3 motifs in the peak, which reduces the proportions by 3–6 fold; thus, these may be underestimates of heterodimer binding, which may be better able to bind adjacent weak-affinity sites compared to the individual factors alone. The background regions are ATAC-seq open regions lacking H3K27ac enrichment (N=5413). (G) Cumulative distributions of distance from a Pou5f3-bound (left) or Sox3-bound (right) regulatory element. Curves represent gene groups according to the degree that they are affected by pou5f3.3/sox3 morpholino treatment. P values are from Kruskal-Wallis tests. (H) Maps showing density of Pou5f3-bound (left) and Sox3-bound (right) regulatory elements around paired homeologous TSSs, divided into elements with differential homeologous L&S binding (i.e. one bound, the other not) versus both L & S homeologous region bound. TSSs are grouped according to whether both L & S homeologs are down-regulated by pou5f3.3/sox3 morpholino treatment, or only one or the other homeolog is down regulated. For Pou5f3, p=2.2 × 10⁻⁸, Kruskal-Wallis test for L-S differential bound enhancer count difference among the three gene groups; for Sox3, p=2.9 × 10⁻¹⁰. For both-bound enhancers, p=0.09 for Pou5f3, p=0.17 for Sox3. (I) Heatmaps showing Pou5f3 and Sox3 CUT&RUN binding enrichment over no-antibody control, plotted over homeologous enhancers as previously defined by ATAC-seq and H3K27ac.
|