
- Title
-
FGF19 promotes nasopharyngeal carcinoma progression by inducing angiogenesis via inhibiting TRIM21-mediated ANXA2 ubiquitination
- Authors
- Shi, S., Zhang, Q., Zhang, K., Chen, W., Xie, H., Pan, S., Xue, Z., You, B., Zhao, J., You, Y.
- Source
- Full text @ Cell Oncol (Dordr)
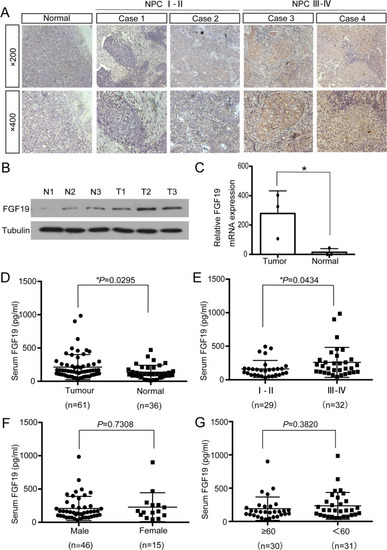
FGF19 is highly expressed in NPC. A: Representative results of immunohistochemical staining. The first column: IHC detection of FGF19 in nasopharyngeal epithelium tissues. The second and third columns: IHC detection of FGF19 in NPC tissues of stage I-II. The forth and fifth columns: IHC detection of FGF19 in NPC tissues of stage III-IV (top: × 200, bottom: × 400). B: Western blot analysis of FGF19 expression in 3 NPC tissues and 3 nasopharyngeal epithelium tissues. (T) Nasopharyngeal squamous cell carcinoma tissues. (N) Nasopharyngeal epithelium tissues. Tubulin was used as a control for protein load. C: qRT-PCR was used to detect the relative expression of FGF19 in tissues. D: ELISA was used to detect serum FGF19 levels in 61 NPC patients and 36 healthy volunteers. E: Serum FGF19 levels of NPC patients in stage I- II and stage III- IV. F: Serum FGF19 levels in male and female NPC patients. G: Serum FGF19 levels in NPC patients of different ages. Data are presented as the mean ± SD of three independent assessments. * |

FGF19 regulates NPC cell malignant behaviours. A: Western blot analysis of FGF19 expression in NPC cell lines (CNE1, CNE2, 5-8F, 6-10B, C666-1) and the immortalized normal nasopharyngeal epithelial cell line NP69. B: ELISA was used to detect FGF19 level in culture medium(CM) of different cells. The column showed FGF19 concentration in CM from NPC cells relative to CM from NP69. C: The interference efficiency of shFGF19 was assessed by western blotting in CNE2 and CNE1 cells. D: CCK8 assay was used to determine cell proliferation after transfection with shNC or shFGF19 in CNE2 and CNE1 cells. E, F: Colony formation assay was performed in shNC or shFGF19 cells. We showed the representative images and the quantification analysis. G, H: Transwell assay was used to determine cell migration in shNC or shFGF19 cells. We showed the representative images and the quantification analysis. I, J: Wound healing assay was performed in shNC or shFGF19 cells. Representative images of cell migration were captured at 0 and 48 h with a microscope. The relative migrated width was calculated by the wound width/the distance measured at 0 h. The histogram showed the relative distance of wound. K: |
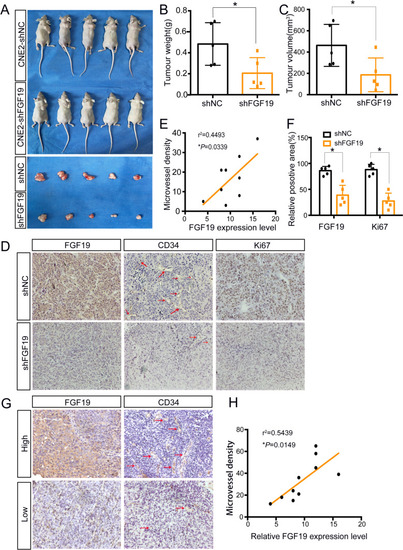
FGF19 promotes NPC growth and positively correlates with MVD in vivo. A: CNE2 cells transfected with shNC or shFGF19 were subcutaneously injected into nude mice. Representative pictures of NPC xenografts in nude mice are shown. B: The weights of the excised xenografts in the two groups. C: The volumes of the excised xenografts in the two groups. D: Representative results of immunohistochemical staining of FGF19, CD34 and Ki67 in xenograft sections. Red arrows indicate microvessels. E: Spearman correlation between FGF19 expression and MVD in tumour xenografts. The Pearson correlation coefficient (r2) and |
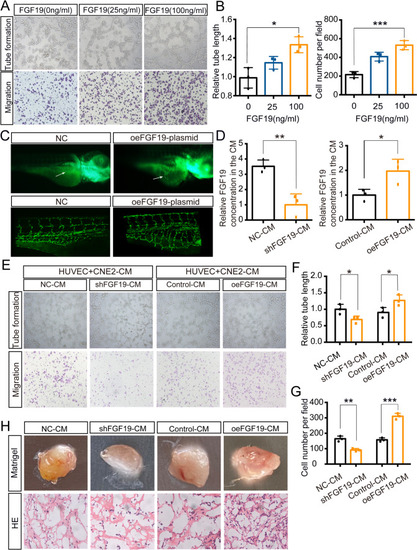
NPC cells secrete FGF19 into HUVECs and promote angiogenesis. A: Tube formation assays (top) and Transwell migration assays (bottom) were performed to measure tube formation and migration of HUVECs treated with increasing doses of FGF19. B: The relative tube length and number of migrated HUVECs were quantified. C: Morphology of subintestinal vessels (SIVs) in |
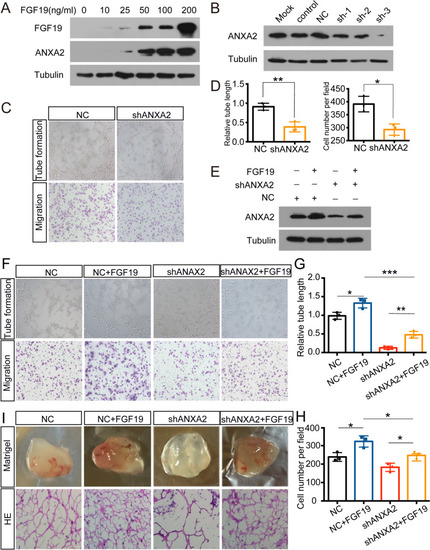
FGF19 influences ANXA2 expression to accelerate angiogenesis. A: ANXA2 expression in HUVECs with the increasing doses of FGF19. B: The interference efficiency of shANXA2 was assessed by western blotting in HUVECs. C, D: Tube formation assays (top) and Transwell migration assays (bottom) were performed to measure tube formation and migration of HUVECs transfected with shNC or shANXA2. E: Western blotting was used to detect ANXA2 expression with the treatment of FGF19 or shANXA2. F: Tube formation assays (top) and Transwell migration assays (bottom) were performed to measure tube formation and migration of HUVECs. G, H: The relative tube length and migrated HUVECs were quantified. I: HUVECs transfected with shANXA2 or shNC and pretreated with FGF19 were mixed with Matrigel for subcutaneous injection. Top: Gross observation of angiogenesis in Matrigel plugs. Bottom: H&E staining was performed to observe blood vessel formation in different groups. Data represent the mean ± SD of three independent experiments. * |
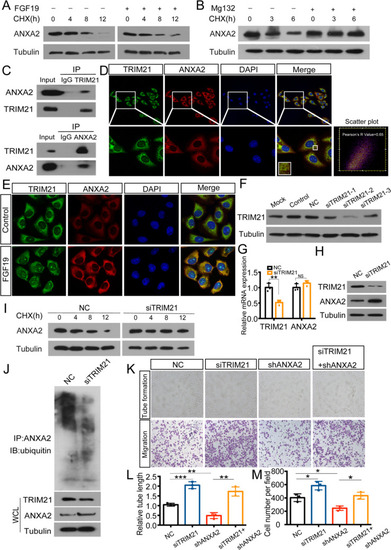
TRIM21 interacts with ANXA2 and triggers ubiquitination. A: ANXA2 expression in HUVECs with or without FGF19 treatment following CHX treatment for the indicated times. B: ANXA2 expression in HUVECs with or without the addition of Mg132 following CHX treatment for the indicated times. C: Co-IP was performed to analyse the interaction between ANXA2 and TRIM21 in HUVECs. IgG was used as a negative control. D: Representative images of colocalization of ANXA2 and TRIM21 in HUVECs. Red: ANXA2; Green: TRIM21. Pearson's R value of scatter plot analysis was calculated using ImageJ. E: ANXA2 and TRIM21 expression in HUVECs after FGF19 treatment was detected by immunofluorescence staining. F: The interference efficiency of siTRIM21 was assessed by western blotting in HUVECs. G: qRT-PCR was used to detect mRNA level of TRIM21 and ANXA2 with the transfection of NC or siTRIM21. H: Western blot was used to detect protein level of TRIM21 and ANXA2 with the transfection of NC or siTRIM21. I: ANXA2 expression in HUVECs transfected with NC or siTRIM21 following CHX treatment for the indicated times. J: HUVECs transfected with NC or siTRIM21 were immunoprecipitated with ANXA2 antibody and analysed by immunoblotting with the anti-ubiquitin antibody to examine ANXA2 ubiquitination. Whole-cell lysates were used for western blotting with an anti-TRIM21 or anti-ANXA2 antibody. K: Tube formation assays (top) and Transwell migration assays (bottom) were performed to measure tube formation and migration of shANXA2-HUVECs transfected with NC or siTRIM21. L, M: The relative tube length and number of migrated HUVECs were quantified. Data represent the mean ± SD of three independent experiments. * |
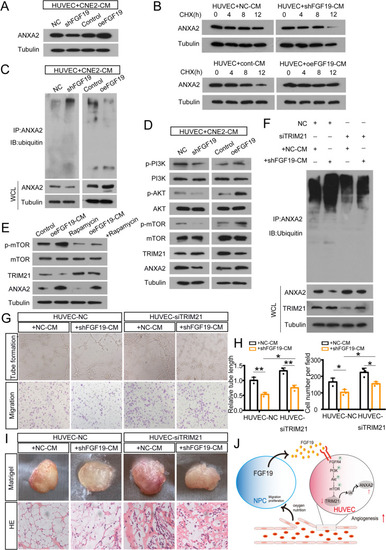
NPC-derived FGF19 upregulates ANXA2 by blocking TRIM21-mediated ubiquitination. A: ANXA2 expression in HUVECs treated with shFGF19-CM or oeFGF19-CM. B: ANXA2 expression in HUVECs treated with shFGF19-CM or oeFGF19-CM following CHX treatment for the indicated times. C: HUVECs treated with shFGF19-CM or oeFGF19-CM were immunoprecipitated with ANXA2 antibody and analysed by immunoblotting with the anti-ubiquitin antibody to examine ANXA2 ubiquitination. D: Western blot analysis of PI3K/AKT/mTOR in HUVECs treated with shFGF19-CM or oeFGF19-CM. E: Western blot analysis of p-mTOR in HUVECs with the treatment of oeFGF19-CM or the addition of rapamycin. F: HUVECs were transfected with siTRIM21 and treated with shFGF19-CM or NC-CM. Then cells were immunoprecipitated with ANXA2 antibody and analyzed by immunoblotting with the anti-ubiquitin antibody to examine ANXA2 ubiquitination. G: Tube formation assays (top) and Transwell migration assays (bottom) were performed to measure tube formation and migration of HUVECs pretransfected with siTRIM21 and cocultured with shFGF19-CM or NC-CM. H: The relative tube length and number of migrated HUVECs were quantified. I: HUVECs transfected with siTRIM21 or NC and cocultured with shFGF19-CM or NC-CM were mixed with Matrigel for subcutaneous injection. Top: Gross observation of angiogenesis in Matrigel plugs. Bottom: H&E staining was performed to observe blood vessel formation in different groups. J: A working model of FGF19 promoting NPC angiogenesis by influencing TRIM21-mediated ANXA2 ubiquitination through the activation of the PI3K/Akt/mTOR pathway. Data represent the mean ± SD of three independent experiments. * |