
- Title
-
Shigella induces epigenetic reprogramming of zebrafish neutrophils
- Authors
- Gomes, M.C., Brokatzky, D., Bielecka, M.K., Wardle, F.C., Mostowy, S.
- Source
- Full text @ Sci Adv
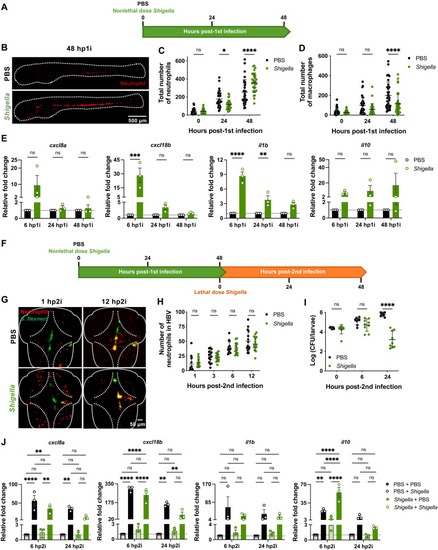
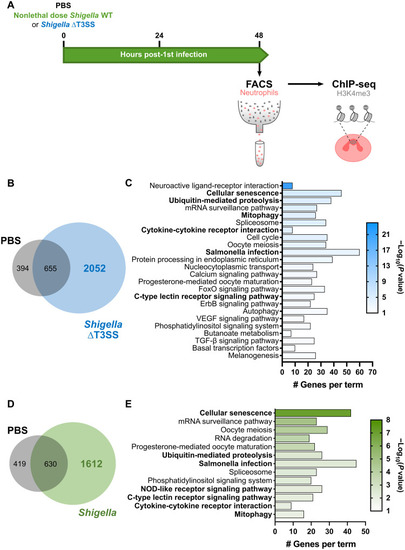
Zebrafish exposure to nonlethal ( |
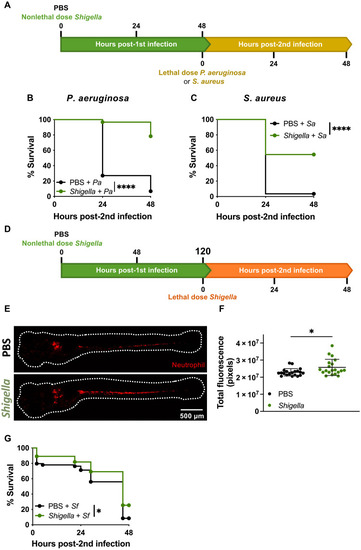
( |
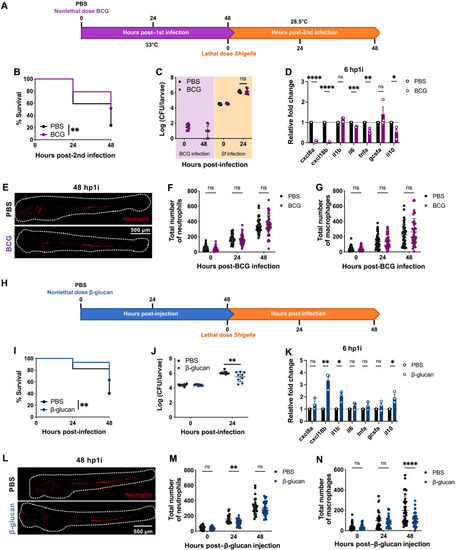
BCG and β-glucan induce protection in zebrafish embryos. ( |
( |
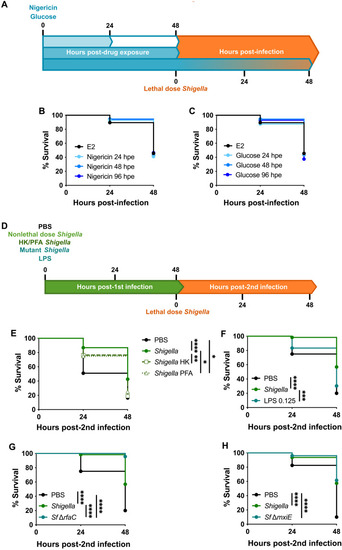
Exposure to ( |
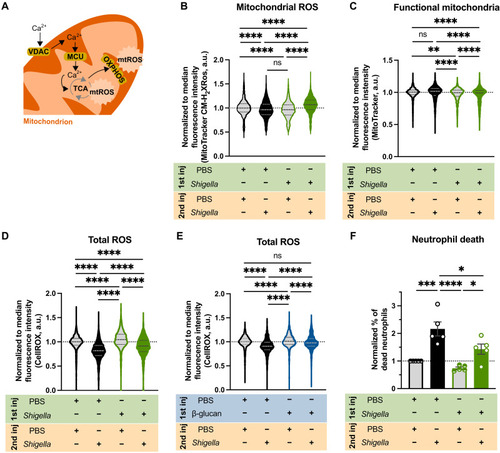
Trained neutrophils produce more mtROS. ( |