FIGURE

Fig. 2.

ID
ZDB-FIG-230916-188
Publication
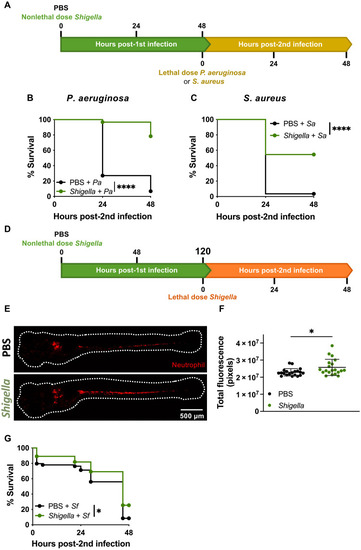
Gomes et al., 2023 - Shigella induces epigenetic reprogramming of zebrafish neutrophils
Other Figures
All Figure Page
Back to All Figure Page
Fig. 2.

Shigella induced protection is nonspecific.

(A) Reinfection of trained larvae with lethal dose injection of P. aeruginosa (Pa) or S. aureus (Sa) at 4 dpf. (B) Survival curves from naïve and Shigella-trained (2.2 × 10³ ± 3.8 × 10² CFUs) larvae infected with P. aeruginosa (PBS, 2.6 × 10³ ± 7.4 × 10² CFUs; Shigella, 2.3 × 10³ ± 5.5 × 10² CFUs). N = 3 with 20 larvae per experiment. (C) Survival curves from naïve and Shigella-trained (1.4 × 10³ ± 8.6 × 10² CFUs) larvae infected with S. aureus (PBS, 3.4 × 10⁴ ± 1.1 × 10⁴ CFUs; Shigella, 3.4 × 10⁴ ± 6 × 10³ CFUs). N = 3 with >20 larvae per experiment. (D) Reinfection of trained larvae with lethal dose injection of Shigella at 7 dpf (or 5 dp1i). (E) Representative images of naïve and Shigella-trained Tg(lyz::dsRed) larvae with at 5 dp1i. Scale bar, 500 μm. (F) Quantification of total fluorescence in Tg(lyz::dsRed) naïve and Shigella-trained (1.7 × 10³ ± 5.7 × 10² CFUs) larvae at 5 dp1i. N = 3 with 10 larvae per time point (mean ± SD). (G) Survival curves from naïve and Shigella-trained larvae infected with Shigella at 5 dp1i. N = 3 with >16 larvae per experiment. *P < 0.05, ****P < 0.0001, log-rank (Mantel-Cox) test (B, C, and G) and unpaired Student’s t test (F).

Expression Data

Expression Detail
Antibody Labeling
Phenotype Data

Phenotype Detail
Acknowledgments
This image is the copyrighted work of the attributed author or publisher, and ZFIN has permission only to display this image to its users. Additional permissions should be obtained from the applicable author or publisher of the image. Full text @ Sci Adv