|
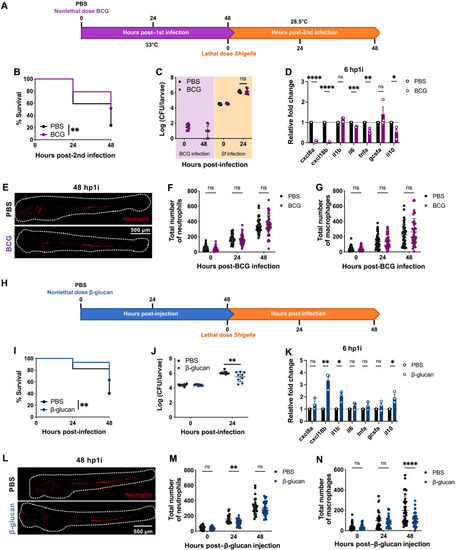
BCG and β-glucan induce protection in zebrafish embryos. (A) Reinfection of BCG-trained larvae with Shigella at 4 dpf. (B) Survival curves (N = 3 with >16 larvae per experiment) and (C) bacterial counts [N = 3 with 3 larvae per time point (mean ± SD)] from naïve and BCG-trained larvae infected with Shigella. (D) Expression of cxcl8a, cxcl18b, il1b, il6, tnfa, gcsfa, and il10 in BCG-trained larvae (4.7 × 101 ± 3.2 × 101 CFUs) as compared to naïve larvae. N = 3 with 10 larvae per time point (mean ± SEM). (E) Representative images of naïve and BCG-trained Tg(lyz::dsRed) larvae at 48 hp1i. Scale bar, 500 μm. (F) Quantification of neutrophils [Tg(lyz::dsRed)] and (G) macrophages [Tg(mpeg::mCherry)] in naïve and BCG-trained larvae [(F) 5.6 × 101 ± 4.3 × 101 CFUs, (G) 6.3 × 101 ± 3.7 × 101 CFUs]. N = 3 with >12 larvae per experiment (mean ± SD). (H) Reinfection of β-glucan–trained larvae with Shigella at 4 dpf. (I) Survival curves (N = 3 with >18 larvae per experiment) and (J) bacterial counts [N = 3 with 3 larvae per time point (mean ± SD)] from naïve and β-glucan–trained (20 ng) larvae infected with Shigella. (K) Expression of cxcl8a, cxcl18b, il1b, il6, tnfa, gcsfa, and il10 in β-glucan–trained larvae (20 ng) as compared to naïve larvae. N = 3 with 10 larvae per time point (mean ± SEM). (L) Representative images of naïve and β-glucan–trained Tg(lyz::dsRed) larvae at 48 hp1i. Scale bar, 500 μm. (M) Quantification of neutrophils [Tg(lyz::dsRed)] and (N) macrophages [Tg(mpeg::mCherry)] in naïve and β-glucan–trained larvae (20 ng). N = 3 with >8 larvae per experiment (mean ± SD). *P < 0.05, **P < 0.01, ***P < 0.001, ****P < 0.0001, log-rank (Mantel-Cox) test (B and I), one-way ANOVA with Tukey’s multiple comparisons test (C and J), unpaired Student’s t test (D and K), and two-way ANOVA with Sidak’s multiple comparisons test (F, G, M, and N).
|