
- Title
-
sox1a:eGFP transgenic line and single-cell transcriptomics reveal the origin of zebrafish intraspinal serotonergic neurons
- Authors
- Chen, F., Köhler, M., Cucun, G., Takamiya, M., Kizil, C., Cosacak, M.I., Rastegar, S.
- Source
- Full text @ iScience

Integration of all single-cell datasets and annotation of main cell types (A) Schematic workflow of scRNA-seq (part of it was created with BioRender.com). (B) UMAP shows the main cell types annotated based on the top marker and known marker genes. (C) A heatmap showing the representative marker genes expressed in main cell types. (D) Feature Plots showing marker genes used to sort in-silico neural progenitor and neuronal cell populations. Note: cldnb is used to exclude lateral line cells, which are gfp+. |
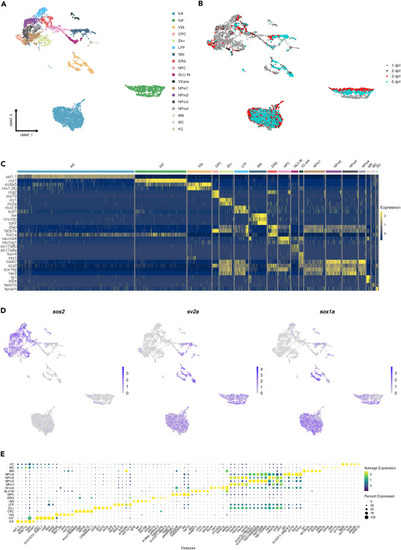
Re-analyses of the neural progenitor population and neurons identify several cell subtypes in the spinal cord (A) UMAP shows the neural progenitors and neuronal sub-clusters. (B) The distribution of cells is based on the developmental stages. (C) A heatmap showing the representative marker genes specifically expressed in each neural progenitor and neuronal subtype. (D) Expression of sox2 (progenitor marker), sv2a (neuronal marker) and sox1a on Feature Plots. (E) Dot Plot showing the top 5 marker genes for each cluster. |
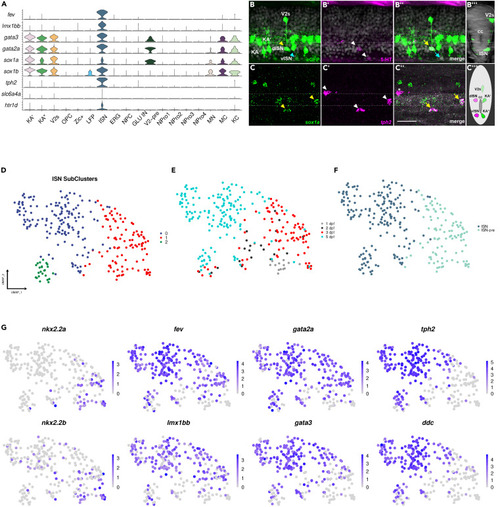
sox1a is expressed in several neuronal populations including ISNs in the zebrafish spinal cord (A) Violin plots showing key marker genes of ISNs co-expressed with sox1a/b. (B-B″) Co-localization of 5-HT antibody staining with eGFP gene expression in the zebrafish spinal cord at 3 dpf. (B) Lateral view of the spinal cord showing GFP+ V2s, KA', KA", more dorsal ISN (dISN) with strong eGFP expression (yellow arrowhead), and more ventral ISN (vISN) with weak eGFP expression (blue arrowhead). (B′) The white arrowhead indicates two 5-HT neurons. (B″) Co-expression of 5-HT with eGFP (yellow arrow: strong eGFP expression, blue arrow: weak eGFP expression). (B‴) Optical transverse section showing a V2s neuron dorsal to the central canal (CC) and an ISN ventral to the CC. (C–C″) Co-expression of sox1a and tph2 mRNA in the zebrafish spinal cord at 3 dpf using HCR-RNA FISH. (C) Yellow arrowheads indicate sox1a+ cells. (C′) White arrowheads indicate three tph2+ neurons. (C″) Yellow arrows indicate neurons that are tph2+ and sox1a+ while white asterisks show a tph2+ and sox1a-neuron. (C‴) Schematic showing the position of all sox1a+ neurons in the zebrafish spinal cord. (D-E) ISN cluster is constituted of diverse cell populations. (D) UMAP shows the sub-clustering of the ISN cluster into three sub-clusters. (E) Distribution of cells based on developmental stages. (F) The majority of the ISN cluster consists of fev+ and tph2- (ISN-pre) or fev+ and tph2+ cells (ISNs). (G) Feature plots showing key TFs specifically or co-expressed in ISN-pre and ISNs. In embryos (B) and (C), the dorsal side is facing upwards, while the ventral side is facing downwards. The anterior side is on the left, and the posterior side is on the right. Scale bar: 25 μm. |
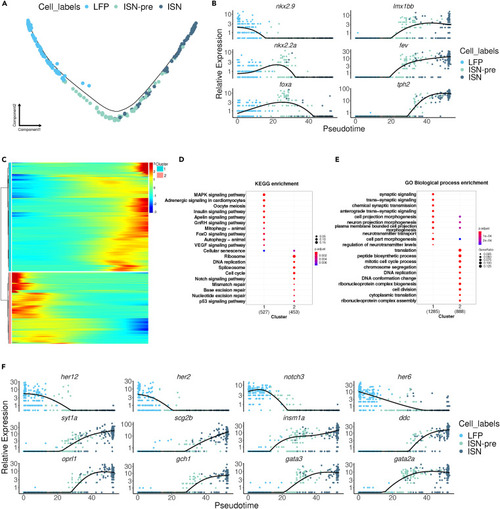
LFP is the precursor of ISNs (A) Pseudotime cell trajectory of LFP, ISN-pre, and ISN cells. (B) The expression of key transcription markers for LFP and ISN is shown on pseudotime. (C) Pseudotime heatmap showing pseudotime-dependent differentially expressed genes between clusters 1 and 2. GO and KEGG analyses of pseudotime-dependent differentially expressed genes between clusters 1 and 2. (D) KEGG pathway analyses. (E) GO analyses for Biological Processes. (F) The expression of key transcription markers for LFP and ISN is shown on pseudotime. |
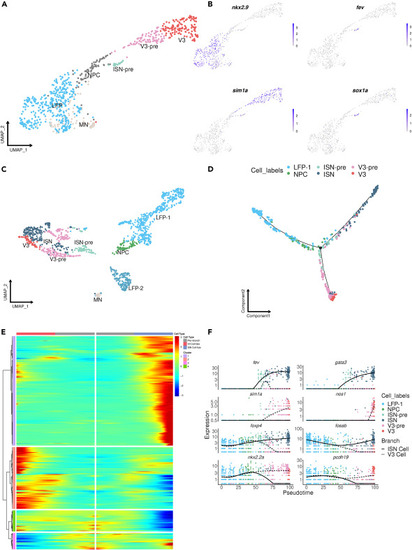
LFP is the precursor of both V3 and ISNs (A) UMAP shows the integration of LFP, V3, and ISN-pre cells and their subtypes (publicly available dataset; Tg(olig2:eGFP).41. (B) Feature plots of marker genes for LFP (nkx2.9), V3 (sim1a), and ISN-pre (fev) cells. (C) UMAP shows the integration of LFP, V3, and ISN cells and their subtypes (current study: Tg(sox1a:eGFP)) integrated with the same cells from Tg(olig2:eGFP). (D) Cell trajectory showing LFP as the precursor of V3 and ISN. (E) Heatmap showing pseudotime-dependent differentially expressed genes between LFP and V3/ISN cells. (F) The expression of key TFs for LFP and ISN/V3 is shown in pseudotime. Note that in (C), LFP-1 corresponds to progenitor cells in proliferation originating from 24 hpf and 36 hpf, while LFP-2 represents older non-proliferative LFP cells that correspond to cells coming from 2, 3, and 5 dpf. For this reason, LFP-2 is not included in the pseudotime analysis in (D). |

Inhibition of the Notch signaling pathway leads to an increase in tph2+ neurons (A and B) HCR RNA-FISH against tph2 mRNA. Arrowheads indicate tph2-expressing neurons. (A) Control embryo treated with DMSO. (B) Embryo treated with the Notch inhibitor LY. (C) Quantification of tph2+ neurons. Embryos were treated from 2 to 3 dpf. The dorsal side is oriented upwards, and the anterior side is oriented toward the left. Statistical significance was assessed using Welch’s t-test, and the level of significance is indicated by the number of asterisks: ∗∗ for p < 0.01. Scale bar: 20 μm. |