
Image
|
Figure Caption
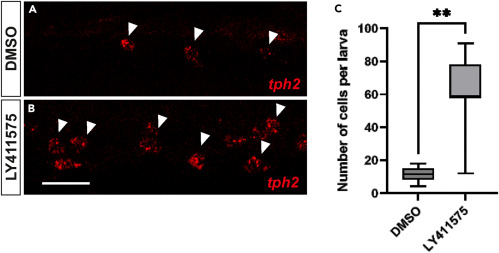
Fig. 6 Inhibition of the Notch signaling pathway leads to an increase in tph2+ neurons (A and B) HCR RNA-FISH against tph2 mRNA. Arrowheads indicate tph2-expressing neurons. (A) Control embryo treated with DMSO. (B) Embryo treated with the Notch inhibitor LY. (C) Quantification of tph2+ neurons. Embryos were treated from 2 to 3 dpf. The dorsal side is oriented upwards, and the anterior side is oriented toward the left. Statistical significance was assessed using Welch’s t-test, and the level of significance is indicated by the number of asterisks: ∗∗ for p < 0.01. Scale bar: 20 μm.
Acknowledgments
This image is the copyrighted work of the attributed author or publisher, and
ZFIN has permission only to display this image to its users.
Additional permissions should be obtained from the applicable author or publisher of the image.
Full text @ iScience