
Fig. 3
- ID
- ZDB-FIG-231207-37
- Publication
- Chen et al., 2023 - sox1a:eGFP transgenic line and single-cell transcriptomics reveal the origin of zebrafish intraspinal serotonergic neurons
- Other Figures
- All Figure Page
- Back to All Figure Page
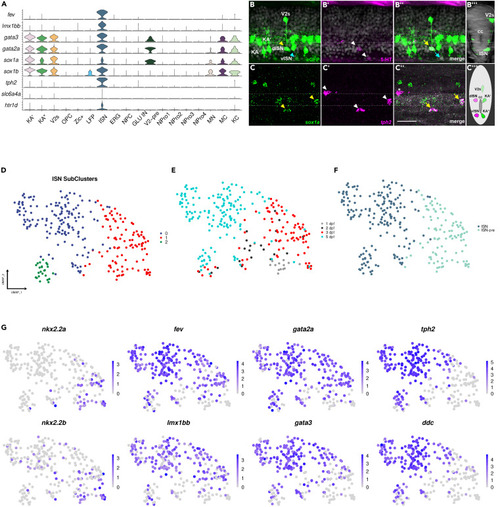
sox1a is expressed in several neuronal populations including ISNs in the zebrafish spinal cord (A) Violin plots showing key marker genes of ISNs co-expressed with sox1a/b. (B-B″) Co-localization of 5-HT antibody staining with eGFP gene expression in the zebrafish spinal cord at 3 dpf. (B) Lateral view of the spinal cord showing GFP+ V2s, KA', KA", more dorsal ISN (dISN) with strong eGFP expression (yellow arrowhead), and more ventral ISN (vISN) with weak eGFP expression (blue arrowhead). (B′) The white arrowhead indicates two 5-HT neurons. (B″) Co-expression of 5-HT with eGFP (yellow arrow: strong eGFP expression, blue arrow: weak eGFP expression). (B‴) Optical transverse section showing a V2s neuron dorsal to the central canal (CC) and an ISN ventral to the CC. (C–C″) Co-expression of sox1a and tph2 mRNA in the zebrafish spinal cord at 3 dpf using HCR-RNA FISH. (C) Yellow arrowheads indicate sox1a+ cells. (C′) White arrowheads indicate three tph2+ neurons. (C″) Yellow arrows indicate neurons that are tph2+ and sox1a+ while white asterisks show a tph2+ and sox1a-neuron. (C‴) Schematic showing the position of all sox1a+ neurons in the zebrafish spinal cord. (D-E) ISN cluster is constituted of diverse cell populations. (D) UMAP shows the sub-clustering of the ISN cluster into three sub-clusters. (E) Distribution of cells based on developmental stages. (F) The majority of the ISN cluster consists of fev+ and tph2- (ISN-pre) or fev+ and tph2+ cells (ISNs). (G) Feature plots showing key TFs specifically or co-expressed in ISN-pre and ISNs. In embryos (B) and (C), the dorsal side is facing upwards, while the ventral side is facing downwards. The anterior side is on the left, and the posterior side is on the right. Scale bar: 25 μm. |