
Image
|
Figure Caption
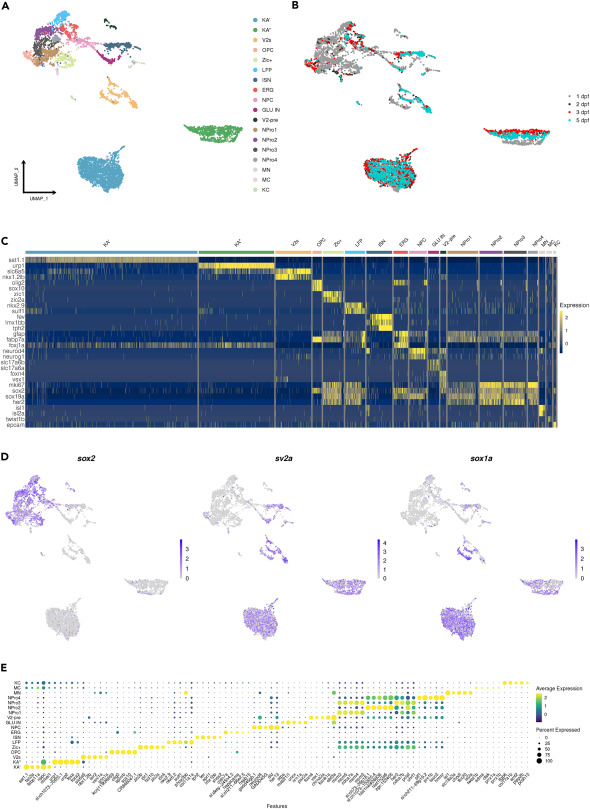
Fig. 2 Re-analyses of the neural progenitor population and neurons identify several cell subtypes in the spinal cord (A) UMAP shows the neural progenitors and neuronal sub-clusters. (B) The distribution of cells is based on the developmental stages. (C) A heatmap showing the representative marker genes specifically expressed in each neural progenitor and neuronal subtype. (D) Expression of sox2 (progenitor marker), sv2a (neuronal marker) and sox1a on Feature Plots. (E) Dot Plot showing the top 5 marker genes for each cluster.
Acknowledgments
This image is the copyrighted work of the attributed author or publisher, and
ZFIN has permission only to display this image to its users.
Additional permissions should be obtained from the applicable author or publisher of the image.
Full text @ iScience