
- Title
-
Post-injury hydraulic fracturing drives fissure formation in the zebrafish basal epidermal cell layer
- Authors
- Kennard, A.S., Sathe, M., Labuz, E.C., Prinz, C.K., Theriot, J.A.
- Source
- Full text @ Curr. Biol.
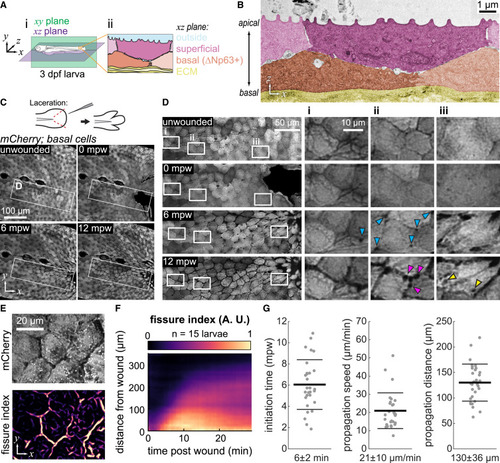
Fissures propagate between epidermal cells during wound healing (A) (Ai) Schematic of a 3-days post fertilization (dpf) zebrafish larva defining the xy (sagittal) and xz (coronal) planes used throughout the paper. (Aii) xz section through the larval epidermis shows the bilayered structure, formed of superficial layer and the basal layer (specified by the ΔNp63 promoter) resting upon the extracellular matrix (ECM). (B) Electron micrograph of unwounded 3-dpf epidermis, pseudocolored according to (Aii). Shades of pink and orange mark the superficial and basal layers, respectively; different shades of the same hue highlight adjacent cells within each layer. (C) Maximum-intensity projections of 3-dpf larva expressing cytoplasmic mCherry in basal cells (TgBAC(ΔNp63:Gal4); Tg(UAS:mCherry)) at different time points after wounding. Schematic of the laceration procedure is illustrated at the top. mpw: minutes post wounding. (D) Insets from (C) revealing the propagation of fissures between basal cells over time after wounding. Blue arrowheads indicate the appearance of dark puncta at tricellular junctions that precedes full fissuring. Yellow arrowheads indicate large dark puncta that appear within cells after fissuring has occurred. Magenta arrowheads highlight the irregular, beads-on-a-string morphology that fissures develop over time. Insets (Di)–(Diii) follow specific cells over time as they migrate to the wound. The cell followed in inset (Diii) migrates the most, consistent with its position nearest the wound. (E) Example of the fissure index image computed from the basal cell mCherry signal. (F) Kymograph of average fissure index demonstrating initial linear propagation of fissuring away from the wound, followed by slower propagation after about 12 min. Fissure index is averaged over 15 larvae. (G) Quantified fissure dynamics, including the initiation time of fissuring, the propagation speed during the initial linear propagation interval, and the spatial extent of linear propagation. Each dot represents an individual larva (n ≥ 29), and the thick and thin bars represent the mean ± 1 standard deviation. |

Gaps between basal cells develop soon after wounding (A–D) Electron micrograph xz planes of 3-dpf epidermis before wounding (A) or at various times after wounding (B–D). Each micrograph is accompanied by a camera lucida drawing to guide the eye. Coloring of camera lucida drawings matches that in Figure 1Aii; the cell shown in green (D) has a nuclear morphology consistent with that of an immune cell. Gaps between cells emerge as early as 2 mpw, coalesce by 7 mpw, and by 20 mpw they appear at cell-cell junctions at the interface between superficial and basal cells. White arrowhead in (B): superficial cell further away from the wound retains the flat apical surface and curved basal surface seen in unwounded cells. Black arrowhead in (B): superficial cell closer to the wound has an inverted shape, with a curved apical surface and a flattened basal surface. |

Fissured cells remain connected through cell-cell junctions (A) Surface projections (see STAR Methods) from a time lapse following wounding of 3-dpf larvae expressing mCherry in basal cells and E-cadherin in basal and superficial cells: TgBAC(ΔNp63:Gal4); Tg(UAS:mCherry); TgBAC(cdh1:cdh1-sfGFP). E-cadherin remains localized at the cell periphery in both layers, despite fissuring in the basal layer. To facilitate comparison of the distribution of E-cadherin, image intensity was bleach-corrected at each time point by rescaling (see STAR Methods). (B) Electron micrograph of the cell-cell junction between two basal cells at 2 mpw. Blue arrowhead in the inset indicates the electron-dense staining characteristic of desmosomal plaques, and the yellow arrowhead indicates intermediate filaments. (C) Serial histological sections of epidermis at 20 mpw, taken at 1-μm increments along the y (dorsal-ventral) axis. White arrowhead: the gaps on either side of the basal cells are revealed in the y = 3 μm section to be contiguous across the apical surface of the cell. Black arrowhead: large rounded gap between two basal cells. Yellow arrowheads: tethers connect basal cells to other basal cells and to superficial cells. (D) 3D reconstruction of basal cells from 20 mpw larva shown in (C). Gaps between cells resemble fissures in confocal microscopy and are contiguous with each other along the interface between basal and superficial layers. (E) Live single-plane images of basal layer cells 20 mpw of a 3-dpf larva expressing Lifeact-GFP in basal cells and Cdh1-tdTomato in all epithelial cells: TgBAC(ΔNp63:Gal4); Tg(UAS:LifeAct-EGFP); Tg(cdh1-tdTomato) that were wounded in the presence of E3 media and imaged using an instantaneous structured illumination microscope (iSIM). Red arrowheads indicate a tether between neighboring basal cells containing both E-cadherin and F-actin. |
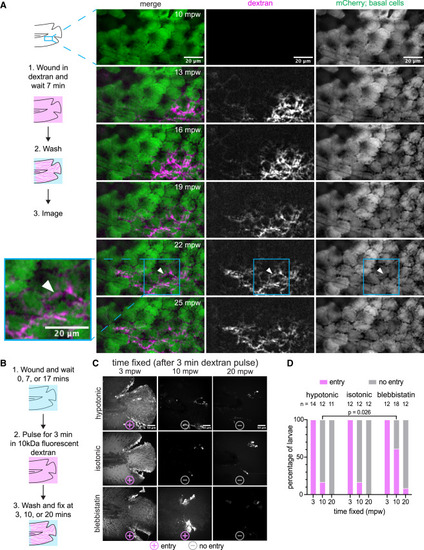
External dextran enters via the open wound in vivo and in fixed larvae (A) (Left) Schematic of the experimental workflow. Briefly, the larva was wounded in the presence of TMR dextran and incubated for 7 min. Larva was then washed with E3 media for 3 min and was imaged live in 1-min intervals. White arrowhead at 22 mpw illustrates an example of dextran flow across the middle of a cell rather than along a cell boundary, possibly due to flow across the apical surface of the cell. (Right) Maximum-intensity projections from a time lapse following wounding of a 3-dpf larva expressing mCherry in the basal cells that were wounded in the presence of E3 media, supplemented with 2 mg/mL 10 kDa TMR dextran. (TgBAC(ΔNp63:Gal4); Tg(UAS:mCherry)). (B) Visual diagram of the workflow for fixed dextran assays. (1) Larva were wounded in either E3 media (hypotonic), 270 mM sorbitol (isotonic medium), or E3 media supplemented with 50 μM para-nitro blebbistatin. (2) After 0, 7, and 17 min of waiting, the larvae were pulsed with 2 mg/mL of TMR dextran (hypotonic and isotonic) or AF680-dextran (blebbistatin) for 3 min. (3) Larvae were washed, fixed, and imaged. (C) Maximum-intensity projections from the fixed larvae processed as described in (B). Larvae were scored ± for dextran entry, depicted with symbols below each image. (D) Percentage of larvae in each condition scored for dextran entry. The number of larvae for each condition is shown above the corresponding bar. A significantly higher proportion of larvae were infiltrated with dextran after 10 mpw in blebbistatin vs. hypotonic medium (p = 0.026, Fisher’s exact test). |
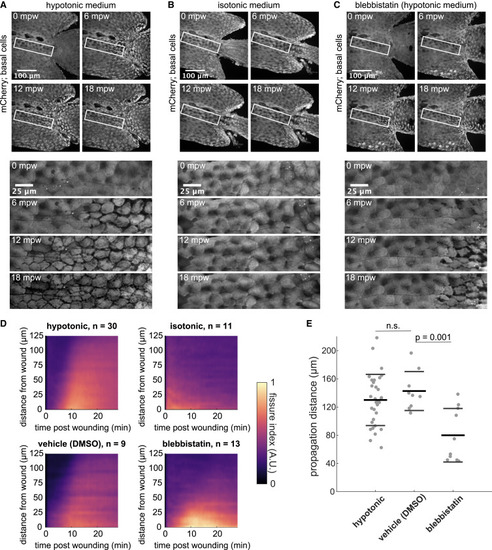
Osmotic gradients and tissue contractility promote fissuring (A) (Top) Tailfin over time from a 3-dpf larva lacerated in E3 (hypotonic medium) and expressing mCherry in basal cells: (TgBAC(ΔNp63:Gal4); Tg(UAS:mCherry)). Wound occurred 1–2 min earlier. (Bottom) Insets shown below the time-lapse series. (B) Larva wounded as in (A) in E3 supplemented with 270 mM sorbitol (isotonic medium). (C) Larva wounded as in (A) in E3 supplemented with 50 μM para-nitro blebbistatin. (A)–(C) are maximum-intensity Z projections from spinning disk confocal images. (D) Kymograph indicating the fissure index over time at a given distance from the wound, averaged from larvae wounded in hypotonic E3 (n = 30) or E3 supplemented with 270 mM sorbitol (n = 11), 50 μM para-nitro blebbistatin (n = 13), or 0.1% DMSO as a vehicle control for blebbistatin (n = 9). The fissure index was analyzed as described in STAR Methods and Figure 1. Data from larvae used in Figure 1F were incorporated into the average hypotonic fissure kymograph shown here (top left). (E) Quantified fissure dynamics for larvae that scored positively for fissure formation. Each dot is an individual larva (n ≥ 9). Thick and thin bars indicate the mean ± 1 standard deviation for that condition. According to one-way ANOVA followed by Tukey’s test, vehicle control is not significantly different from hypotonic (n.s., p > 0.05) and blebbistatin is significantly different from the vehicle control (p = 0.0010). Hypotonic data from Figure 1G is also plotted here for comparison. See also Videos S5 and S6. |
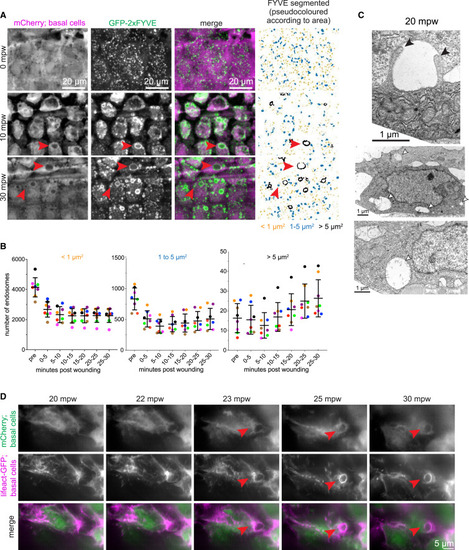
External fluid is cleared via macropinocytosis (A) Maximum-intensity projections from a time lapse following wounding of a 3-dpf larva expressing mCherry and GFP-2xFYVE in the basal cells that were wounded in the presence of E3 media: (TgBAC(ΔNp63:Gal4); Tg(UAS:mCherry); Tg(UAS:2xFYVE-GFP)). First and second columns show the mCherry and GFP-FYVE channels, respectively. Third column shows the merge. Fourth column shows segmentation of the GFP-FYVE. The segmented structures were divided into three categories and pseudocolored (orange: < 1 μm2; blue: 1–5 μm2; and black: >5 μm2). Red arrowheads show large endocytic structures. Full sized images are shown in Figure S4. (B) Graph shows quantification of mean endocytic structures over a 5-min window as indicated for three different size categories (left: < 1 μm2; middle: 1–5 μm2; and right: >5 μm2). Each fish is colored uniquely (n = 8) and represented as dots. Lines represent mean ± standard deviation across all the fishes. Note the difference in y axis between the different plots. (C) Electron micrographs of basal cells in 3-dpf larvae treated with DMSO and wounded 20 min prior to fixation. White arrowheads highlight examples of large internal vesicles consistent with macropinosomes. Black arrowheads point out two protrusions from the apical side of a basal cell, possibly in the process of macropinocytosis. (D) Maximum-intensity projections from a group of basal layer cells time lapse following wounding of a 3-dpf larva expressing mCherry and Lifeact-GFP in the basal cells that were wounded in the presence of E3 media, (TgBAC(ΔNp63:Gal4); Tg(UAS:mCherry); Tg(UAS:LifeAct-EGFP)), and imaged using instant structured illumination microscope. Red arrowheads show large endocytic structures consistent with macropinosomes. |

Model for wound-induced hydraulic fissuring Overview of fissure formation during wound healing in zebrafish larval epidermis. (1) An unwounded tailfin showing an intact basal layer. (2) After wounding, osmotic gradients drive external fluid through the open wound. (3) The myosin II purse string contracts along the wound margin, further forcing the external fluid anteriorly into the epithelial tissue. (4) The combination of the hydrostatic and cytoskeletal forces causes the hydraulic fracturing of the basal cells and fissure propagation anteriorly to the wound. (5) The excess fluid is subsequently cleared by the surrounding basal cells via macropinocytosis over longer timescales. |