
|
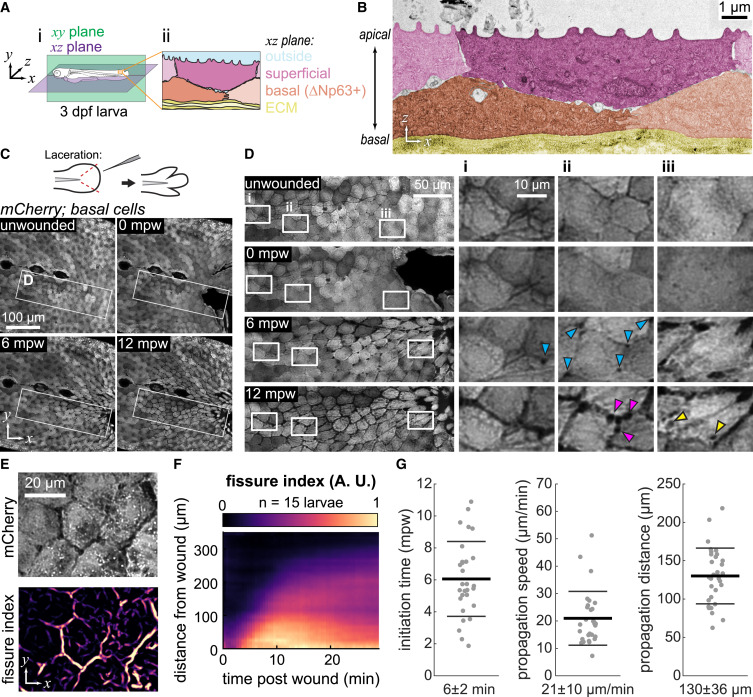
Fig. 1 Fissures propagate between epidermal cells during wound healing (A) (Ai) Schematic of a 3-days post fertilization (dpf) zebrafish larva defining the xy (sagittal) and xz (coronal) planes used throughout the paper. (Aii) xz section through the larval epidermis shows the bilayered structure, formed of superficial layer and the basal layer (specified by the ΔNp63 promoter) resting upon the extracellular matrix (ECM). (B) Electron micrograph of unwounded 3-dpf epidermis, pseudocolored according to (Aii). Shades of pink and orange mark the superficial and basal layers, respectively; different shades of the same hue highlight adjacent cells within each layer. (C) Maximum-intensity projections of 3-dpf larva expressing cytoplasmic mCherry in basal cells (TgBAC(ΔNp63:Gal4); Tg(UAS:mCherry)) at different time points after wounding. Schematic of the laceration procedure is illustrated at the top. mpw: minutes post wounding. (D) Insets from (C) revealing the propagation of fissures between basal cells over time after wounding. Blue arrowheads indicate the appearance of dark puncta at tricellular junctions that precedes full fissuring. Yellow arrowheads indicate large dark puncta that appear within cells after fissuring has occurred. Magenta arrowheads highlight the irregular, beads-on-a-string morphology that fissures develop over time. Insets (Di)–(Diii) follow specific cells over time as they migrate to the wound. The cell followed in inset (Diii) migrates the most, consistent with its position nearest the wound. (E) Example of the fissure index image computed from the basal cell mCherry signal. (F) Kymograph of average fissure index demonstrating initial linear propagation of fissuring away from the wound, followed by slower propagation after about 12 min. Fissure index is averaged over 15 larvae. (G) Quantified fissure dynamics, including the initiation time of fissuring, the propagation speed during the initial linear propagation interval, and the spatial extent of linear propagation. Each dot represents an individual larva (n ≥ 29), and the thick and thin bars represent the mean ± 1 standard deviation.