
- Title
-
3D printing of PLA:CaP:GO scaffolds for bone tissue applications
- Authors
- González-Rodríguez, L., Pérez-Davila, S., Lama, R., López-Álvarez, M., Serra, J., Novoa, B., Figueras, A., González, P.
- Source
- Full text @ RSC Adv.
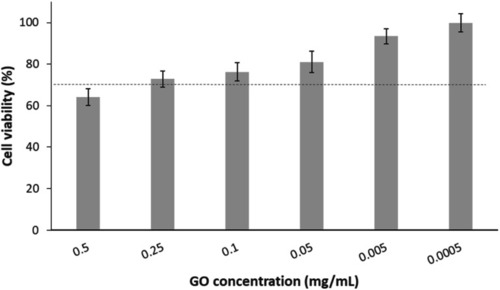
Cell viability of MG-63 after exposure to different concentrations of GO for 24 h. The dotted line indicates the acceptable limit of cytotoxicity according to the UNE-EN-ISO 10993-5:2009 standard. Data are presented as mean ±cumulative error. |
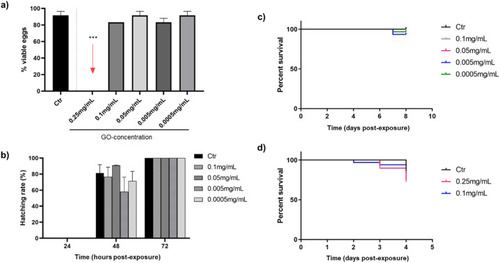
Toxicity response of zebrafish embryos and larvae at different concentrations of GO through two exposition routes: viability rate of embryos at 24 hpe by bath (a), hatching rate during 72 hpe (b), viability rate of larvae exposed to GO by bath for 7 dpe (c) and viability rate of larvae exposed to GO by microinjection for 72 hpe (d). In all cases the results are shown with respect to the control (Ctr). |
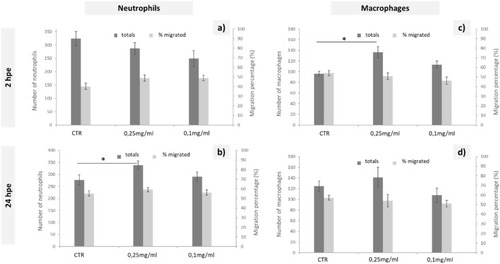
Quantification of neutrophil (a and b) and macrophage (c and d) behaviour in response to the injection of different solutions of GO in zebrafish transgenic embryos (3dpf) with fluorescently labelled immune cells, from 2 to 24 hpe. Data are presented as mean ±SEM. Statistically significant differences from the control group are indicated by *, p < 0.05. |
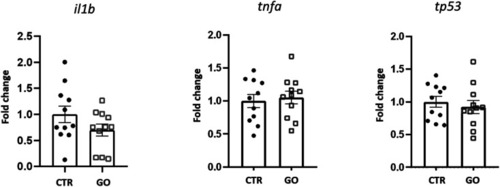
Expression profile of genes related to inflammatory/immune response in zebrafish larvae 24 h after being microinjected with 0.1 mg mL−1 of GO. Data are presented as mean of fold changes, calculated with respect to the basal expression of each gene (CTR), ±standard error of the mean. |
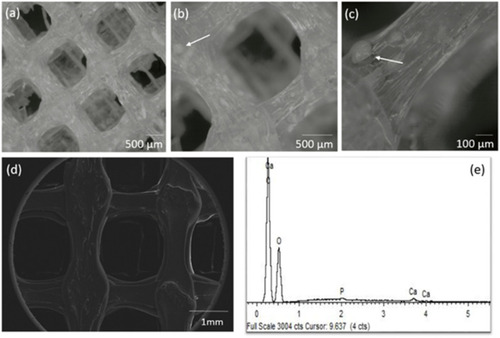
Stereo micrographs in different magnifications (a–c), SEM (d) and corresponding EDS spectrum (e) of the PLA:CaP:GO scaffold with 3.4 wt% of CaP and 0.10 mg mL−1 of GO (0.004 wt%) (d and e). |
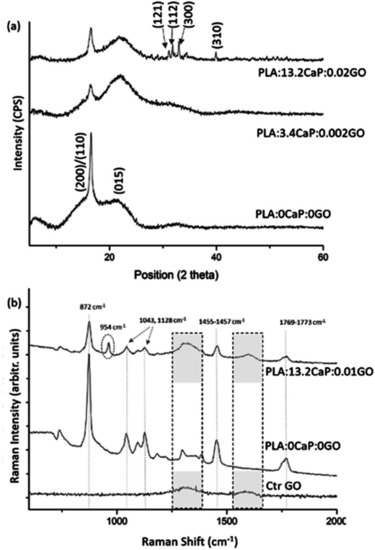
XRD diffraction pattern of the 3D printed PLA:CaP:GO scaffolds (a) and FT-Raman spectra showing the characteristic bands for each of the scaffold components (b). In both cases the sample PLA:0CaP:0GO is taken as reference, as well as the GO for FT-Raman. For Raman spectra, the regions associated with GO (1300–1600 cm−1) are highlighted with pointed square, while the band corresponding to CaP is enclosed by a dotted circle. |
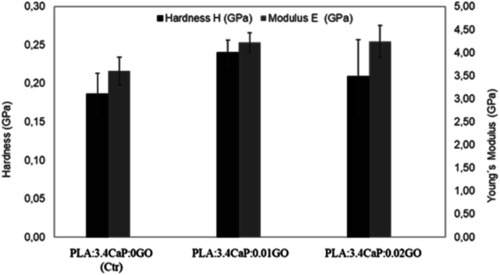
Young's modulus and hardness of different PLA:CaP:GO scaffolds. In the bar chart means ±standard errors are represented. |
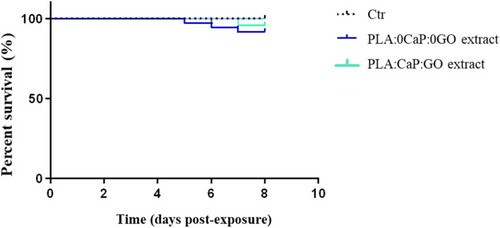
Toxicity response of zebrafish larvae exposed to extracts obtained from PLA:CaP:GO scaffolds (with 3.4 wt% of CaP and 0.004 wt% of GO) for 30 days: viability rate of WT embryos 7 dpe by bath. |