
Image
|
Figure Caption
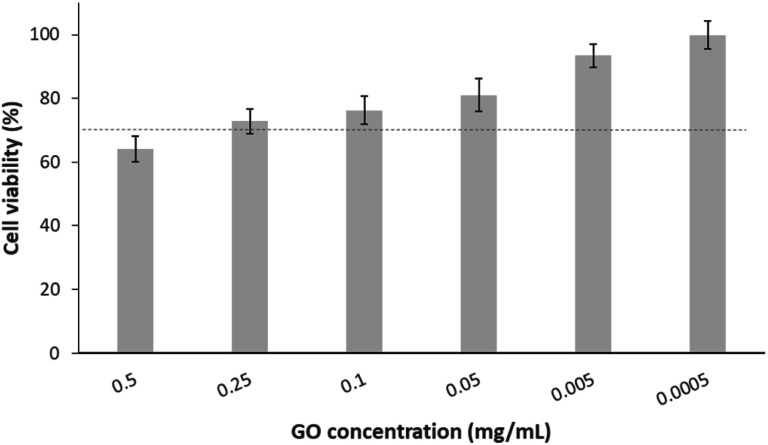
Fig. 1 Cell viability of MG-63 after exposure to different concentrations of GO for 24 h. The dotted line indicates the acceptable limit of cytotoxicity according to the UNE-EN-ISO 10993-5:2009 standard. Data are presented as mean ±cumulative error.
Acknowledgments
This image is the copyrighted work of the attributed author or publisher, and
ZFIN has permission only to display this image to its users.
Additional permissions should be obtained from the applicable author or publisher of the image.
Full text @ RSC Adv.