
Image
|
Figure Caption
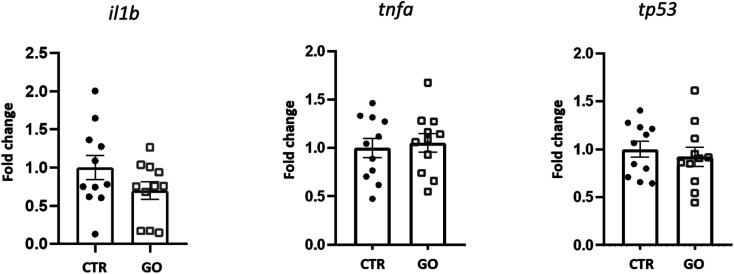
Fig. 4 Expression profile of genes related to inflammatory/immune response in zebrafish larvae 24 h after being microinjected with 0.1 mg mL−1 of GO. Data are presented as mean of fold changes, calculated with respect to the basal expression of each gene (CTR), ±standard error of the mean.
Acknowledgments
This image is the copyrighted work of the attributed author or publisher, and
ZFIN has permission only to display this image to its users.
Additional permissions should be obtained from the applicable author or publisher of the image.
Full text @ RSC Adv.