
Image
|
Figure Caption
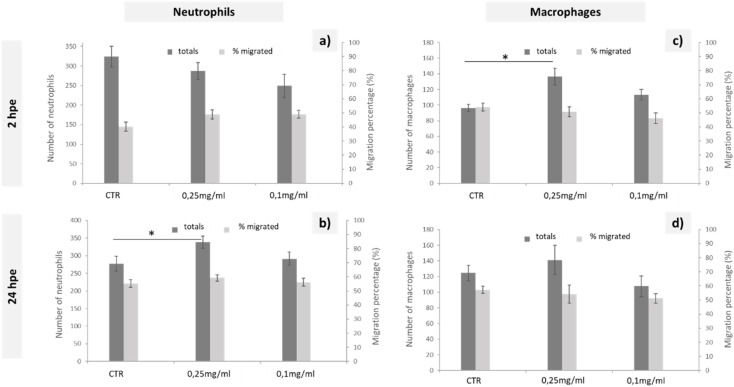
Fig. 3 Quantification of neutrophil (a and b) and macrophage (c and d) behaviour in response to the injection of different solutions of GO in zebrafish transgenic embryos (3dpf) with fluorescently labelled immune cells, from 2 to 24 hpe. Data are presented as mean ±SEM. Statistically significant differences from the control group are indicated by *, p < 0.05.
Acknowledgments
This image is the copyrighted work of the attributed author or publisher, and
ZFIN has permission only to display this image to its users.
Additional permissions should be obtained from the applicable author or publisher of the image.
Full text @ RSC Adv.