
Image
|
Figure Caption
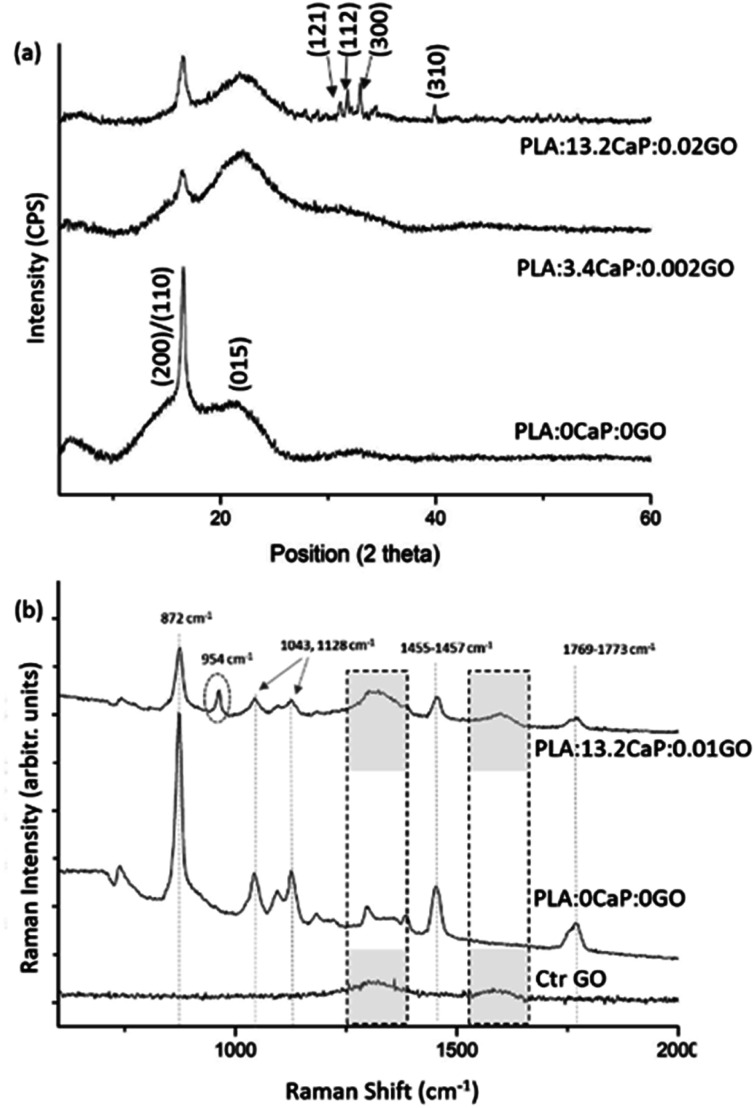
Fig. 6 XRD diffraction pattern of the 3D printed PLA:CaP:GO scaffolds (a) and FT-Raman spectra showing the characteristic bands for each of the scaffold components (b). In both cases the sample PLA:0CaP:0GO is taken as reference, as well as the GO for FT-Raman. For Raman spectra, the regions associated with GO (1300–1600 cm−1) are highlighted with pointed square, while the band corresponding to CaP is enclosed by a dotted circle.
Acknowledgments
This image is the copyrighted work of the attributed author or publisher, and
ZFIN has permission only to display this image to its users.
Additional permissions should be obtained from the applicable author or publisher of the image.
Full text @ RSC Adv.