
- Title
-
Subpopulations of hypocretin/orexin neurons differ in measures of their cell proliferation, dynorphin co-expression, projections, and response to embryonic ethanol exposure
- Authors
- Yasmin, N., Collier, A.D., Karatayev, O., Abdulai, A.R., Yu, B., Fam, M., Khalizova, N., Leibowitz, S.F.
- Source
- Full text @ Sci. Rep.
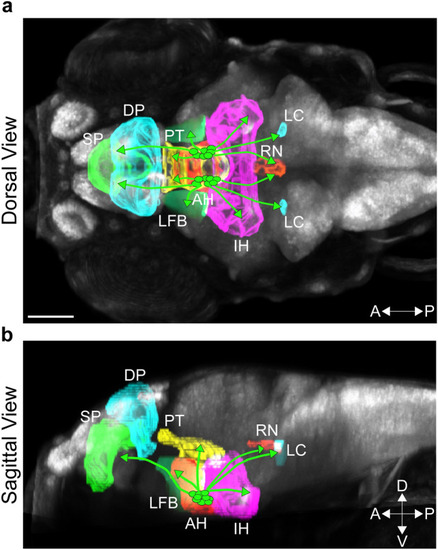
Photomicrographs illustrating brain regions of interest innervated by Hcrt neurons in a 6 dpf zebrafish brain. Brain regions derived from the Zebrafish Brain Browser33 are illustrated by different colors within a representative zebrafish brain, shown from a dorsal view (a) and sagittal view (b). Brain regions of interest from anterior to posterior include the SP (green), DP (light blue) and PT (yellow) in the anterior brain, AH (red), IH (pink) and LFB (light green) within the hypothalamic area, and the LC (light blue) and RN (orange) in the posterior brain. Hcrt neurons are represented by circles (green) within the AH, with lines from these neurons representing their projections to the different brain regions. Scale bar: 100 µm. Abbreviations: aAH: anterior part of the anterior hypothalamus, pAH: posterior part of the anterior hypothalamus, POA: preoptic area, SP: subpallium, DP: dorsal pallium, PT: posterior tuberculum, IH: intermediate hypothalamus, LFB: lateral forebrain bundle, RN: raphe nucleus, LC: locus coeruleus, Hcrt: hypocretin, dpf: days post fertilization, A: anterior, P: posterior, D: Dorsal, V: ventral. |
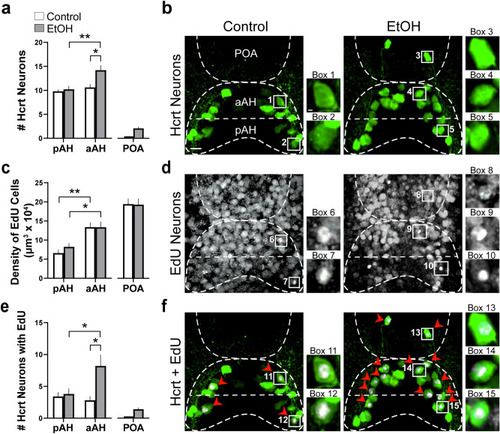
Effects of exposure to embryonic EtOH (0.5% v/v, 22–24 hpf) on the number of Hcrt neurons, the density of EdU cells, and the number of Hcrt neurons co-expressing EdU within the pAH, aAH and POA of 6 dpf transgenic Hcrt:EGFP zebrafish brains. (a) Bar graphs (n = 5/group) show that EtOH increases the number of Hcrt neurons in the aAH but not the pAH relative to control, causes the number in the aAH to be greater than in the pAH of EtOH-treated zebrafish, and induces a few ectopic Hcrt neurons (2.2 ± 0.374) further anterior in the POA that are not detected in control zebrafish. (Two-way ANOVA, EtOH main effect: (F (1, 16) = 7.339, p = 0.016), Brain area main effect: (F (1, 16) = 10.57, p = 0.005), EtOH x Brain area interaction: (F (1, 16) = 4.697, p = 0.046), followed by Holm-Sidak post-hoc described in the text). (b) Photomicrographs (40×, dorsal view) illustrate Hcrt neurons (green) after immunofluorescence staining that are located in the pAH and aAH of control and EtOH-treated zebrafish and are ectopically expressed in the POA of EtOH-treated zebrafish. Boxes 1–2 show enlargements of single Hcrt neurons in the aAH and pAH of control, respectively, and boxes 3–5 show enlargements of Hcrt neurons in the POA, aAH, and pAH of EtOH, respectively. (c) Bar graphs (n = 5/group) show that the density of EdU cells in the aAH is greater than the density in the pAH of both control and EtOH zebrafish, and EtOH has no effect on the density of EdU-expressing cells in the pAH, aAH or POA. (Two-way ANOVA, EtOH main effect: EtOH main effect (F (1, 24) = 0.199, p = 0.660), Brain area main effect: (F (2, 24) = 43.03, p < 0.0001), EtOH x Brain area interaction: (F (2, 24) = 0.291, p = 0.751), Holm-Sidak post-hoc test described in text). (d) Photomicrographs (25×, dorsal view) show EdU labeling (white) in the pAH, aAH and POA of control and EtOH zebrafish. Boxes 6–7 show enlargements of EdU cells located in the aAH and pAH, respectively, of control zebrafish, and boxes 8–10 show enlargements of EdU cells located in the POA, aAH, and pAH of EtOH-treated zebrafish, respectively. (e) Bar graphs (n = 5/group) show that EtOH increases the co-expression of Hcrt with EdU in the aAH but not the pAH, and in the EtOH-treated zebrafish there are more Hcrt neurons co-expressing EdU in the aAH than the pAH. Ectopic POA Hcrt neurons are also found to co-express EdU in EtOH-treated zebrafish (1.4 ± 0.245). (Two-way ANOVA, EtOH main effect: (F (1, 16) = 7.188, p = 0.164), Brain area main effect: (F (1, 16) = 3.085, p = 0.0981), EtOH x Brain area interaction: (F (1, 16) = 5.342, p = 0.420), followed by Holm-Sidak post-hoc described in the text). (f) Photomicrographs (25×, dorsal view) illustrate an overlay of Hcrt (green) and EdU labeling (white) and their co-expression. Boxes 11–12 show enlargements of single Hcrt neurons co-expressing EdU in the pAH and aAH of control, respectively, and boxes 13–15 show enlargements of single Hcrt neurons co-expressing EdU in the POA, aAH, and pAH, respectively. Scale bars: low magnification 10 µm; high magnification 2 µm. All results are shown as means ± standard errors. Abbreviations: EtOH: ethanol, aAH: anterior part of the anterior hypothalamus, pAH: posterior part of the anterior hypothalamus, POA: preoptic area, Hcrt: hypocretin, EdU: 5–ethynyl–2′–deoxyuridine, hpf: hours post fertilization, dpf: days post fertilization. |
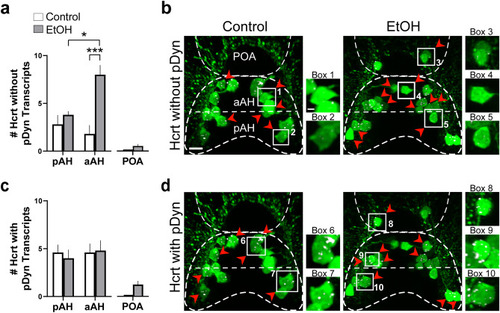
Effects of exposure to embryonic EtOH (0.5% v/v, 22–24 hpf) on the number of Hcrt neurons with and without co-expression of transcripts of the neuropeptide pDyn within the pAH, aAH and POA of 6 dpf transgenic Hcrt:EGFP zebrafish brains. (a) Bar graphs (n = 5/group) show that EtOH increases the number of Hcrt neurons with no pDyn expression in the aAH but not the pAH, causing the aAH to have a greater number of Hcrt neurons with no pDyn expression than the pAH and inducing an ectopic Hcrt neuron (0.6 ± 0.245) in the POA of EtOH-treated zebrafish having no pDyn expression. (Two-way ANOVA, EtOH main effect: (F (1, 16) = 17.75, p = 0.0007), Brain area main effect: (F (1, 16) = 3.507, p = 0.0794), EtOH x Brain area interaction: (F (1, 16) = 9.260, p = 0.0078), followed by Holm-Sidak post-hoc described in the text). (b) Photomicrographs (40×, dorsal view) illustrate Hcrt neurons (green) after immunofluorescence and RNAscope staining with no pDyn (white) expression, as indicated by red arrows. Boxes 1–2 show enlargements of single Hcrt neurons with no pDyn expression located in the aAH and pAH of control, respectively, and boxes 3–5 show enlargements of Hcrt neurons with no pDyn expression located in the POA, aAH, and pAH of EtOH-treated zebrafish, respectively. (c) Bar graphs (n = 5/group) show that EtOH compared to control has no effect on the number of Hcrt neurons with pDyn expression in the pAH or aAH and induces some (1.2 ± 0.374) ectopic Hcrt neurons in the POA of EtOH treated zebrafish having pDyn expression. (Two-way ANOVA, EtOH main effect: treatment (F (1, 16) = 0.046, p = 0.833), Brain area main effect: (F (1, 16) = 0.1850, p = 0.6729), EtOH x Brain area interaction: (F (1, 16) = 0.1850, p = 0.6729), followed by Holm-Sidak post-hoc described in the text). (d) Photomicrographs (40×, dorsal view) illustrate Hcrt neurons (green) after immunofluorescence and RNAscope staining with pDyn (white) expression, as indicated by red arrows. Boxes 1–2 show enlargements of single Hcrt neurons with pDyn expression located in the aAH and pAH of control, respectively, and boxes 3–5 show enlargements of Hcrt neurons with pDyn expression located in the POA, aAH, and pAH of EtOH-treated zebrafish, respectively. Scale bars: low magnification 10 µm; high magnification 2 µm. All results are shown as means ± standard errors. Abbreviations: EtOH: ethanol, pDyn: prodynorpin, aAH: anterior part of the anterior hypothalamus, pAH: posterior part of the anterior hypothalamus, POA: preoptic area, Hcrt: hypocretin, hpf: hours post fertilization, dpf: days post fertilization. |
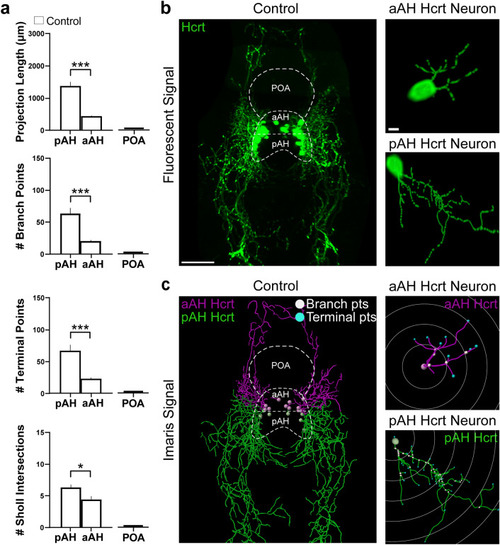
Characterization under control conditions of the projections from the Hcrt neuron subpopulations in the pAH and aAH of 6 dpf transgenic Hcrt:EGFP zebrafish brains, along with an illustration of the Imaris software methodology used to quantify the branching, terminal points and sholl intersections of these projections. (a) Bar graphs (n = 5/group) show in control fish that the projections from pAH Hcrt neurons compared to those from aAH neurons have greater projection length and number of branch points, terminal points, and sholl intersections, with no Hcrt neurons or projections detected in the POA as indicated by flat bars in the graphs. (b) Photomicrograph (25×, dorsal view) obtained using confocal microscopy illustrates in a control Hcrt:EGFP zebrafish brain a representative image of the Hcrt neurons and projections (green) from the subpopulations, with the pAH, aAH and POA areas outlined by dashed lines and enlargements of a single representative Hcrt neuron along with its projections observed in the aAH (top) and pAH (bottom). (c) A digital representation created from the same confocal image using the “Filaments” function of Imaris software shows that the projections from Hcrt neurons located in the pAH (green) are primarily descending in the posterior direction, while the projections from Hcrt neurons located within the aAH (magenta) are primarily ascending in the anterior direction. The measures of projection length and number of branch points (white), terminal points (blue), and sholl intersections are derived from an analysis using Imaris “spots” of this digital reconstruction. Enlargements show with Imaris software the projections of a single representative Hcrt neuron located in the aAH (top) and pAH (bottom), with the white concentric circles starting at the projection point of origin of the Hcrt soma extending outwards to demonstrate the sholl intersection analysis, with the projection intersections through these circles used to measure the spatial distribution of these projections. Scale bars: low magnification 50 µm; high magnification 10 µm. Abbreviations: aAH: anterior part of the anterior hypothalamus, pAH: posterior part of the anterior hypothalamus, POA: preoptic area, Hcrt: hypocretin, dpf: days post fertilization. |
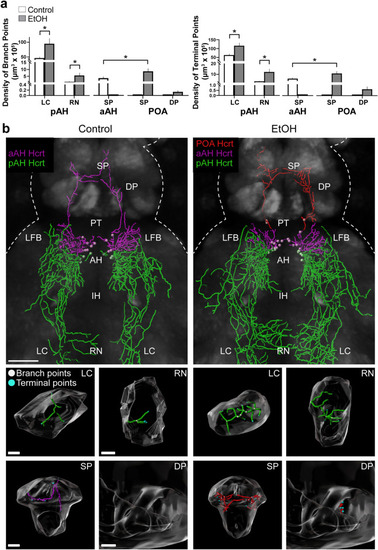
Effects of embryonic exposure to EtOH (0.5% v/v, 22–24 hpf) on the density in specific brain areas of branch points and terminal points of the long projections from Hcrt neurons in the pAH, aAH and POA of 6 dpf transgenic Hcrt:EGFP zebrafish brains. (a) Bar graphs (n = 5/group) show that EtOH increases the density of branch points (left) and terminal points (right) of the long descending projections from the pAH Hcrt neurons to the LC and RN. EtOH also stimulates the long ascending projections to the SP from aAH Hcrt neurons that are evident in control but not after EtOH exposure, causing them to become ectopically expressed in the POA and increasing the density of their branch points (left) and terminal points (right) in the SP while also inducing branch points and terminal points in the DP. The data for analysis of the short Hcrt projections, to areas within the hypothalamus (pAH, aAH and IH) and adjacent to this structure (LFB and PT), are described in the text and presented in Supplementary Table, S2. The absence of aAH projection data in the SP of the EtOH condition and POA projection data in the SP and DP of the control condition are indicated by flat bars in the graphs (b) Photomicrographs (25×, dorsal view) illustrate Imaris software representations of projections from Hcrt neurons in the pAH (green) and aAH (magenta) of both control and EtOH-treated zebrafish and from Hcrt neurons ectopically located in the POA (red) of EtOH-treated zebrafish, with branch points indicated by white dots and terminal points indicated by blue dots. Enlargements of the LC, RN, SP and DP found to be innervated by the long projections are presented below, illustrating in control and EtOH fish the branch points (white) and terminal points (blue) of the projections from Hcrt neurons in the pAH (green) and aAH (magenta) in control and EtOH fist and from the POA (red) in EtOH fish. Scale bars: low magnification 50 µm; LC: 10 µm; RN: 15 µm; SP: 20 µm; DP: 20 µm. All results are shown as means ± standard errors. Abbreviations: EtOH: ethanol, aAH: anterior part of the anterior hypothalamus, pAH: posterior part of the anterior hypothalamus, POA: preoptic area, SP: subpallium, DP: dorsal pallium, PT: posterior tuberculum, IH: intermediate hypothalamus, LFB: lateral forebrain bundle, RN: raphe nucleus, LC: locus coeruleus, Hcrt: hypocretin, hpf: hours post fertilization, dpf: days post fertilization. |