
|
Figure 3
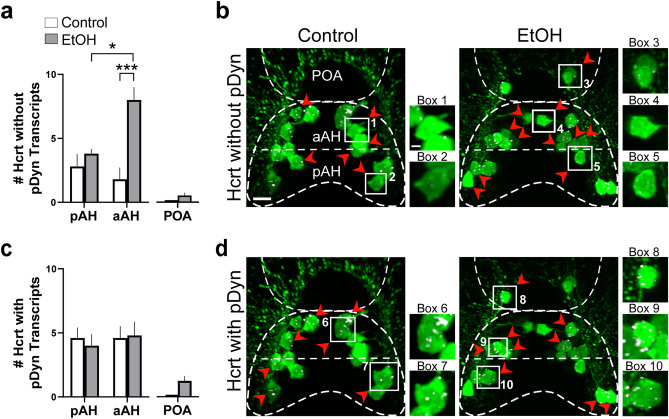
Effects of exposure to embryonic EtOH (0.5% v/v, 22–24 hpf) on the number of Hcrt neurons with and without co-expression of transcripts of the neuropeptide pDyn within the pAH, aAH and POA of 6 dpf transgenic Hcrt:EGFP zebrafish brains. (a) Bar graphs (n = 5/group) show that EtOH increases the number of Hcrt neurons with no pDyn expression in the aAH but not the pAH, causing the aAH to have a greater number of Hcrt neurons with no pDyn expression than the pAH and inducing an ectopic Hcrt neuron (0.6 ± 0.245) in the POA of EtOH-treated zebrafish having no pDyn expression. (Two-way ANOVA, EtOH main effect: (F (1, 16) = 17.75, p = 0.0007), Brain area main effect: (F (1, 16) = 3.507, p = 0.0794), EtOH x Brain area interaction: (F (1, 16) = 9.260, p = 0.0078), followed by Holm-Sidak post-hoc described in the text). (b) Photomicrographs (40×, dorsal view) illustrate Hcrt neurons (green) after immunofluorescence and RNAscope staining with no pDyn (white) expression, as indicated by red arrows. Boxes 1–2 show enlargements of single Hcrt neurons with no pDyn expression located in the aAH and pAH of control, respectively, and boxes 3–5 show enlargements of Hcrt neurons with no pDyn expression located in the POA, aAH, and pAH of EtOH-treated zebrafish, respectively. (c) Bar graphs (n = 5/group) show that EtOH compared to control has no effect on the number of Hcrt neurons with pDyn expression in the pAH or aAH and induces some (1.2 ± 0.374) ectopic Hcrt neurons in the POA of EtOH treated zebrafish having pDyn expression. (Two-way ANOVA, EtOH main effect: treatment (F (1, 16) = 0.046, p = 0.833), Brain area main effect: (F (1, 16) = 0.1850, p = 0.6729), EtOH x Brain area interaction: (F (1, 16) = 0.1850, p = 0.6729), followed by Holm-Sidak post-hoc described in the text). (d) Photomicrographs (40×, dorsal view) illustrate Hcrt neurons (green) after immunofluorescence and RNAscope staining with pDyn (white) expression, as indicated by red arrows. Boxes 1–2 show enlargements of single Hcrt neurons with pDyn expression located in the aAH and pAH of control, respectively, and boxes 3–5 show enlargements of Hcrt neurons with pDyn expression located in the POA, aAH, and pAH of EtOH-treated zebrafish, respectively. Scale bars: low magnification 10 µm; high magnification 2 µm. All results are shown as means ± standard errors. Abbreviations: EtOH: ethanol, pDyn: prodynorpin, aAH: anterior part of the anterior hypothalamus, pAH: posterior part of the anterior hypothalamus, POA: preoptic area, Hcrt: hypocretin, hpf: hours post fertilization, dpf: days post fertilization.