
Figure 1
- ID
- ZDB-FIG-230529-1
- Publication
- Yasmin et al., 2023 - Subpopulations of hypocretin/orexin neurons differ in measures of their cell proliferation, dynorphin co-expression, projections, and response to embryonic ethanol exposure
- Other Figures
- All Figure Page
- Back to All Figure Page
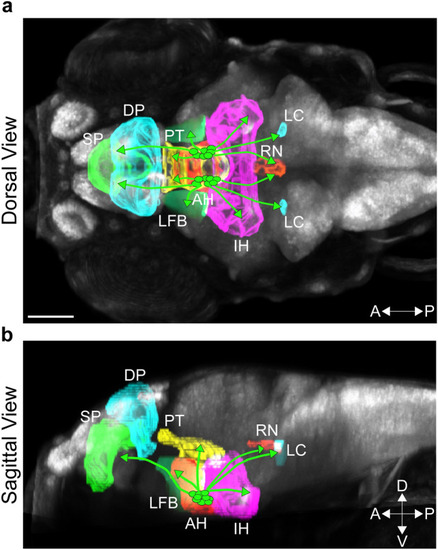
Photomicrographs illustrating brain regions of interest innervated by Hcrt neurons in a 6 dpf zebrafish brain. Brain regions derived from the Zebrafish Brain Browser33 are illustrated by different colors within a representative zebrafish brain, shown from a dorsal view (a) and sagittal view (b). Brain regions of interest from anterior to posterior include the SP (green), DP (light blue) and PT (yellow) in the anterior brain, AH (red), IH (pink) and LFB (light green) within the hypothalamic area, and the LC (light blue) and RN (orange) in the posterior brain. Hcrt neurons are represented by circles (green) within the AH, with lines from these neurons representing their projections to the different brain regions. Scale bar: 100 µm. Abbreviations: aAH: anterior part of the anterior hypothalamus, pAH: posterior part of the anterior hypothalamus, POA: preoptic area, SP: subpallium, DP: dorsal pallium, PT: posterior tuberculum, IH: intermediate hypothalamus, LFB: lateral forebrain bundle, RN: raphe nucleus, LC: locus coeruleus, Hcrt: hypocretin, dpf: days post fertilization, A: anterior, P: posterior, D: Dorsal, V: ventral. |