
Figure 2
- ID
- ZDB-FIG-230529-2
- Publication
- Yasmin et al., 2023 - Subpopulations of hypocretin/orexin neurons differ in measures of their cell proliferation, dynorphin co-expression, projections, and response to embryonic ethanol exposure
- Other Figures
- All Figure Page
- Back to All Figure Page
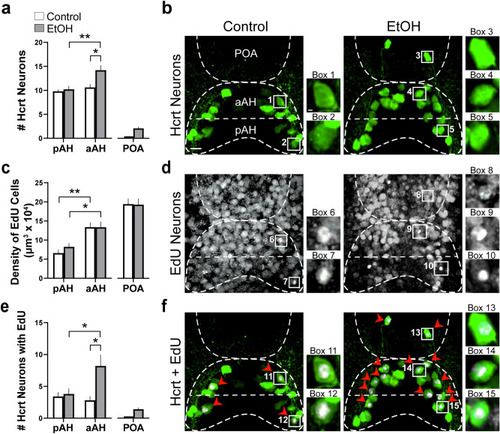
Effects of exposure to embryonic EtOH (0.5% v/v, 22–24 hpf) on the number of Hcrt neurons, the density of EdU cells, and the number of Hcrt neurons co-expressing EdU within the pAH, aAH and POA of 6 dpf transgenic Hcrt:EGFP zebrafish brains. (a) Bar graphs (n = 5/group) show that EtOH increases the number of Hcrt neurons in the aAH but not the pAH relative to control, causes the number in the aAH to be greater than in the pAH of EtOH-treated zebrafish, and induces a few ectopic Hcrt neurons (2.2 ± 0.374) further anterior in the POA that are not detected in control zebrafish. (Two-way ANOVA, EtOH main effect: (F (1, 16) = 7.339, p = 0.016), Brain area main effect: (F (1, 16) = 10.57, p = 0.005), EtOH x Brain area interaction: (F (1, 16) = 4.697, p = 0.046), followed by Holm-Sidak post-hoc described in the text). (b) Photomicrographs (40×, dorsal view) illustrate Hcrt neurons (green) after immunofluorescence staining that are located in the pAH and aAH of control and EtOH-treated zebrafish and are ectopically expressed in the POA of EtOH-treated zebrafish. Boxes 1–2 show enlargements of single Hcrt neurons in the aAH and pAH of control, respectively, and boxes 3–5 show enlargements of Hcrt neurons in the POA, aAH, and pAH of EtOH, respectively. (c) Bar graphs (n = 5/group) show that the density of EdU cells in the aAH is greater than the density in the pAH of both control and EtOH zebrafish, and EtOH has no effect on the density of EdU-expressing cells in the pAH, aAH or POA. (Two-way ANOVA, EtOH main effect: EtOH main effect (F (1, 24) = 0.199, p = 0.660), Brain area main effect: (F (2, 24) = 43.03, p < 0.0001), EtOH x Brain area interaction: (F (2, 24) = 0.291, p = 0.751), Holm-Sidak post-hoc test described in text). (d) Photomicrographs (25×, dorsal view) show EdU labeling (white) in the pAH, aAH and POA of control and EtOH zebrafish. Boxes 6–7 show enlargements of EdU cells located in the aAH and pAH, respectively, of control zebrafish, and boxes 8–10 show enlargements of EdU cells located in the POA, aAH, and pAH of EtOH-treated zebrafish, respectively. (e) Bar graphs (n = 5/group) show that EtOH increases the co-expression of Hcrt with EdU in the aAH but not the pAH, and in the EtOH-treated zebrafish there are more Hcrt neurons co-expressing EdU in the aAH than the pAH. Ectopic POA Hcrt neurons are also found to co-express EdU in EtOH-treated zebrafish (1.4 ± 0.245). (Two-way ANOVA, EtOH main effect: (F (1, 16) = 7.188, p = 0.164), Brain area main effect: (F (1, 16) = 3.085, p = 0.0981), EtOH x Brain area interaction: (F (1, 16) = 5.342, p = 0.420), followed by Holm-Sidak post-hoc described in the text). (f) Photomicrographs (25×, dorsal view) illustrate an overlay of Hcrt (green) and EdU labeling (white) and their co-expression. Boxes 11–12 show enlargements of single Hcrt neurons co-expressing EdU in the pAH and aAH of control, respectively, and boxes 13–15 show enlargements of single Hcrt neurons co-expressing EdU in the POA, aAH, and pAH, respectively. Scale bars: low magnification 10 µm; high magnification 2 µm. All results are shown as means ± standard errors. Abbreviations: EtOH: ethanol, aAH: anterior part of the anterior hypothalamus, pAH: posterior part of the anterior hypothalamus, POA: preoptic area, Hcrt: hypocretin, EdU: 5–ethynyl–2′–deoxyuridine, hpf: hours post fertilization, dpf: days post fertilization. |