
Figure 5
- ID
- ZDB-FIG-230529-7
- Publication
- Yasmin et al., 2023 - Subpopulations of hypocretin/orexin neurons differ in measures of their cell proliferation, dynorphin co-expression, projections, and response to embryonic ethanol exposure
- Other Figures
- All Figure Page
- Back to All Figure Page
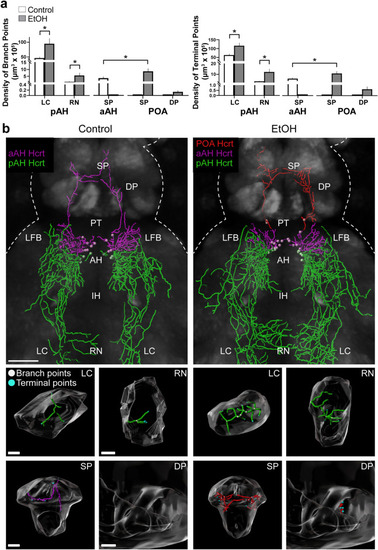
Effects of embryonic exposure to EtOH (0.5% v/v, 22–24 hpf) on the density in specific brain areas of branch points and terminal points of the long projections from Hcrt neurons in the pAH, aAH and POA of 6 dpf transgenic Hcrt:EGFP zebrafish brains. (a) Bar graphs (n = 5/group) show that EtOH increases the density of branch points (left) and terminal points (right) of the long descending projections from the pAH Hcrt neurons to the LC and RN. EtOH also stimulates the long ascending projections to the SP from aAH Hcrt neurons that are evident in control but not after EtOH exposure, causing them to become ectopically expressed in the POA and increasing the density of their branch points (left) and terminal points (right) in the SP while also inducing branch points and terminal points in the DP. The data for analysis of the short Hcrt projections, to areas within the hypothalamus (pAH, aAH and IH) and adjacent to this structure (LFB and PT), are described in the text and presented in Supplementary Table, S2. The absence of aAH projection data in the SP of the EtOH condition and POA projection data in the SP and DP of the control condition are indicated by flat bars in the graphs (b) Photomicrographs (25×, dorsal view) illustrate Imaris software representations of projections from Hcrt neurons in the pAH (green) and aAH (magenta) of both control and EtOH-treated zebrafish and from Hcrt neurons ectopically located in the POA (red) of EtOH-treated zebrafish, with branch points indicated by white dots and terminal points indicated by blue dots. Enlargements of the LC, RN, SP and DP found to be innervated by the long projections are presented below, illustrating in control and EtOH fish the branch points (white) and terminal points (blue) of the projections from Hcrt neurons in the pAH (green) and aAH (magenta) in control and EtOH fist and from the POA (red) in EtOH fish. Scale bars: low magnification 50 µm; LC: 10 µm; RN: 15 µm; SP: 20 µm; DP: 20 µm. All results are shown as means ± standard errors. Abbreviations: EtOH: ethanol, aAH: anterior part of the anterior hypothalamus, pAH: posterior part of the anterior hypothalamus, POA: preoptic area, SP: subpallium, DP: dorsal pallium, PT: posterior tuberculum, IH: intermediate hypothalamus, LFB: lateral forebrain bundle, RN: raphe nucleus, LC: locus coeruleus, Hcrt: hypocretin, hpf: hours post fertilization, dpf: days post fertilization. |