
- Title
-
Cryo-EM structure of the Mon1-Ccz1-RMC1 complex reveals molecular basis of metazoan RAB7A activation
- Authors
- Yong, X., Jia, G., Liu, Z., Zhou, C., Yi, J., Tang, Y., Chen, L., Chen, L., Wang, Y., Sun, Q., Billadeau, D.D., Su, Z., Jia, D.
- Source
- Full text @ Proc. Natl. Acad. Sci. USA
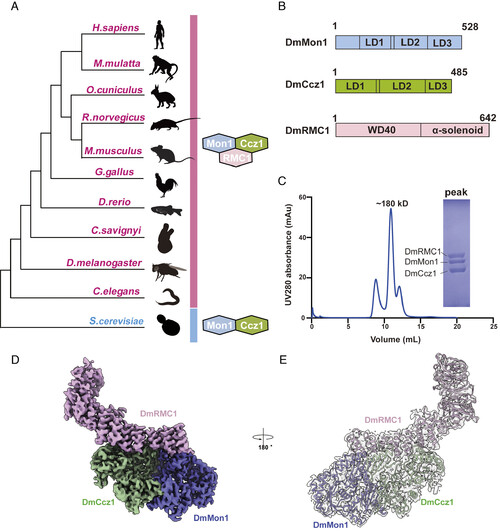
Cryo-EM structure of the metazoan Mon1–Ccz1–RMC1 complex. (A) Cartoon representation incorporating the results of multiple phylogenetic analyses, including Mon1, Ccz1, and RMC1. The gene families that contain Mon1 and Ccz1 are present across eukaryotes, while RMC1 only exists in metazoans. (B) Schematic domain organization of DmMon1–Ccz1–RMC1 subunits. WD40, α-solenoid and LDs (LD1 to LD3) are indicated. Dm: D. melanogaster. (C) Gel filtration profile of DmMon1–Ccz1–RMC1 complex. The horizontal axis represents elution volume, and the vertical axis represents ultraviolet (UV) absorption. The peak and estimated molecular mass of targeted proteins are labeled. The Coomassie blue-stained sodium dodecyl sulfate–polyacrylamide gel electrophoresis (SDS/PAGE) gel shows the peak fraction of the DmMon1–Ccz1–RMC1 complex from gel filtration. (D) Final Cryo-EM map of the DmMon1–Ccz1–RMC1 complex is shown at 2.87 σ threshold with each subunit colored, respectively (pink for DmRMC1, blue for DmMon1 and green for DmCcz1). (E) Shown are the cryo-EM model and density (2.28 σ threshold) of the DmMon1–Ccz1–RMC1 complex. |

Structural comparison of metazoan Mon1-Ccz1-RMC1 structure with fungal Mon1-Ccz1 structure. (A) Schematic domain organization of CtMon1-Ccz1 subunits. LDs (LD1 to LD3) are indicated. Ct: Chaetomium thermophile. (B) Cryo-EM structure of CtMon1–Ccz1 complex (PDB:7QLA). LD domains of CtMon1 and CtCcz1 are labeled as indicated. (C) Overlay of the DmMon1–Ccz1–RMC1 complex with the CtMon1–Ccz1 complex. Subunits of metazoan complex are colored as in Fig. 1, and subunits of fungal complex are shown in gray. The 15 α-helices of RMC1 α-solenoid are labeled in order. (D) A zoom-in view of the second α-helix of DmCcz1-LD3 with DmRMC1. (E and F) A zoom-in view of DmMon1 LD2 and LD3 domains with DmRMC1 in comparison with CtMon1. The rotation angle between DmMon1 and CtMon1 is shown as indicated. (G) A zoom-in view of DmCcz1 LD2 domain with DmRMC1 in comparison with CtCcz1. The rotation angle between DmCcz1 and CtCcz1 is shown as indicated. |
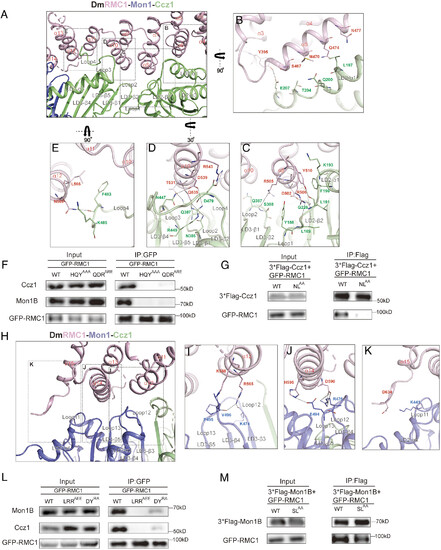
The assembly of RMC1 with Mon1 and Ccz1. (A) Detailed interactions of the interfaces between DmRMC1 (pink) and DmCcz1 (green). Secondary structures of DmRMC1 and DmCcz1 are labeled as indicated. (B–E) Shown are hotspots1–4, with residues critical for stabilizing the interface shown in sticks. The rotation angles are shown as indicated. (F) HEK293T cells were transfected with GFP-tagged RMC1 WT, RMC1HQY/AAA or RMC1QDR/ARE mutants and subjected to GFP-nanotrap for immunoprecipitation. RMC1 and endogenous Ccz1, Mon1B were detected via antibodies against GFP, Ccz1 and Mon1B, respectively. (G) HEK293T cells were cotransfected with GFP-tagged RMC1 and Flag-tagged Ccz1 WT or Ccz1NL/AA mutant, and then subjected to Flag-nanotrap for immunoprecipitation. RMC1 and Ccz1 were detected via antibodies against GFP and Flag, respectively. (H) Detailed interactions of the interfaces between DmRMC1 (pink) and DmMon1 (blue). Secondary structures of DmRMC1 and DmMon1 are labeled as indicated. (I–K) Shown are interfaces between DmRMC1 (pink) and DmMon1 (blue), with residues critical for stabilizing the interface shown in sticks. The rotation angle are shown as indicated. (L) HEK293T cells were transfected with GFP-tagged RMC1 WT, RMC1LRR/AEE or RMC1DY/RA mutants and subjected to GFP-nanotrap for immunoprecipitation. RMC1 and endogenous Mon1B were detected via antibodies against GFP and Mon1B, respectively. (M) HEK293T cells were cotransfected with GFP-tagged RMC1 and Flag-tagged Mon1B WT or Mon1BSL/AA mutant, and then subjected to Flag-nanotrap for immunoprecipitation. RMC1 and Mon1B were detected via antibodies against GFP and Flag, respectively. Black dashed lines indicate hydrogen bonds or salt bridges. |
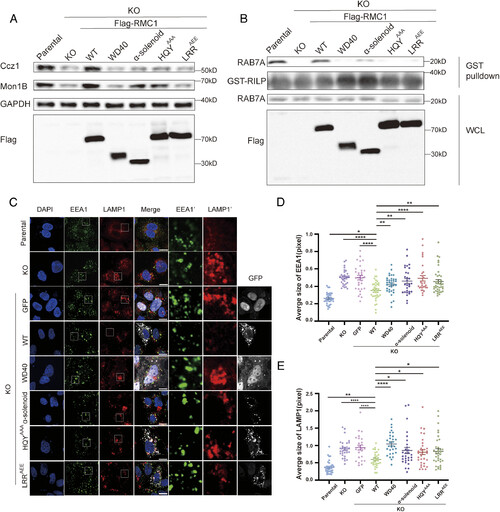
The Mon1-Ccz1-RMC1 assembly is required for cellular RAB7A activation and endolysosomal morphology. (A) Immunoblotting analysis of lysates from parental, RMC1 KO cells and RMC1 KO cells complemented with Flag-tagged RMC1 WT, WD40 (residues 1 to 370), α-solenoid (residues 354 to 642), Ccz1-binding-deficient mutant HQYAAA or Mon1-binding-deficient mutant LRRAEE. Mon1B, Ccz1, GAPDH, and RMC1 were detected by indicated antibodies. (B) GST-RILP was used to pulldown lysates from WT, RMC1 KO cells and RMC1 KO cells complemented with Flag-tagged RMC1 WT, WD40, α-solenoid, HQYAAA or LRRAEE mutants. The levels of endogenous RAB7A-GTP in the pull-down samples were analyzed by immunoblotting. RMC1, RAB7A, and GST-RILP were detected using the indicated antibodies respectively. WCL: whole-cell lysates. (C) Immunofluorescence analysis of WT, RMC1 KO cells and RMC1 KO cells transfected with GFP or indicated GFP-tagged RMC1 constructs. Nuclei were stained with DAPI, early endosomes were stained with an antibody against EEA1, and late endosomes/lysosomes were stained with an antibody against LAMP1. (Scale bar: 10 μm.) EEA1′ and LAMP1′ shows the zoom-in view of EEA1 and LAMP1 in white boxes. (D) The average size of early endosomes (EEA1 positive) per cell in (C) was measured using ImageJ. Error bars represent mean ± SE. Statistical difference was determined by Student’s t test between two selected groups. *P < 0.05, **P < 0.01, ****P < 0.0001. (E) The average size of late endosomes/lysosomes (LAMP1 positive) per cell in (C) was measured using ImageJ. Error bars represent mean ± SE. Statistical difference was determined by Student’s t test between two selected groups. *P < 0.05, **P < 0.01, ****P < 0.0001. |
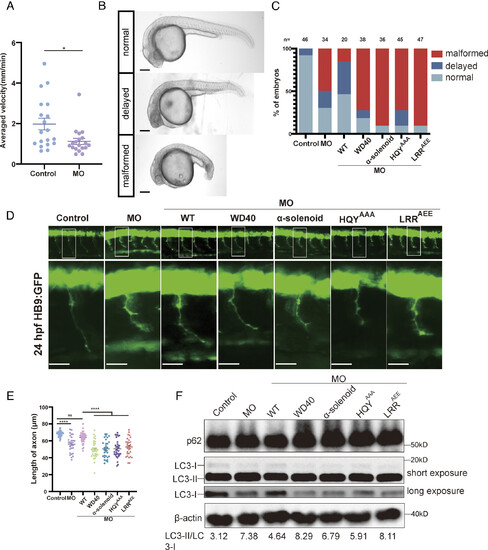
The Mon1-Ccz1-RMC1 assembly is critical for development and autophagic functions in zebrafish. (A) Motor abilities of zebrafish larvae injected with control MO (control) and RMC1 MO (MO) were monitored. Swimming abilities of larvae (control or MO) at 72 hpf (hours post fertilization) were recorded in a 48-well plate using the DanioVision system. The larvae were placed in a resting state for 5 min, then stimulated for 11 min by selected point magnifying sound waves. Each circle represents one larva. Error bars represent mean ± SE. About 19 larvae were used in each group. P values were calculated by Student's t test. *P < 0.05. (B) Classification of zebrafish embryos based on their developmental stage, body and tail morphology. Normal, similar to control fish; Delayed, moderately delayed; Malformed, significantly delayed, microcephalic and short-tailed. (Scale bar: 150 μm.) (C) Ratios of embryos in categories of normal, delayed and malformed, upon injection of MO or coinjection of different mRNAs. Control: control; MO: injection of RMC1 MO; MO+WT: coinjection of RMC1 MO and human RMC1 WT mRNA; MO+WD40: coinjection of MO and WD40 mRNA; MO+α-solenoid mRNA: coinjection of MO and α-solenoid mRNA; MO+HYQAAA: coinjection of MO and HYQAAA mRNA; MO+LRRAEE: coinjection of MO and LRRAEE mRNA. The number of embryos used for statistics are shown above each column. (D) CaP axon morphology from 24 hpf embryos injected with control MO, or RMC1 MO alone or together with different mRNAs indicated in (C) at one-cell stage (Top). Bottom: zoom-in views of white box from top pictures. All injections were performed on the Tg [Hb9: GFP]ml2 transgenic zebrafish embryos. (Scale bar: 25 μm.) (E) Statistical results of the length of CaP axons in embryos treated as in (D). For each group, approximately 30 to 40 axons were used for analysis. Error bars represent mean ± SE, ****P < 0.0001; ns, no significant. P values were calculated using one-way ANOVA, Tukey’s multiple comparisons test. (F) Immunoblotting analysis of LC3 and p62 protein levels in injected embryos and uninjected controls. The protein level of LC3 was detected via both long and short exposure. Embryos were injected with RMC1 MO alone or coinjected with mRNAs encoding RMC1 WT or indicated mutants. Protein samples were extracted at 24 hpf (>50 embryos/sample). The LC3-II/LC3-I ratio is shown below. |