
|
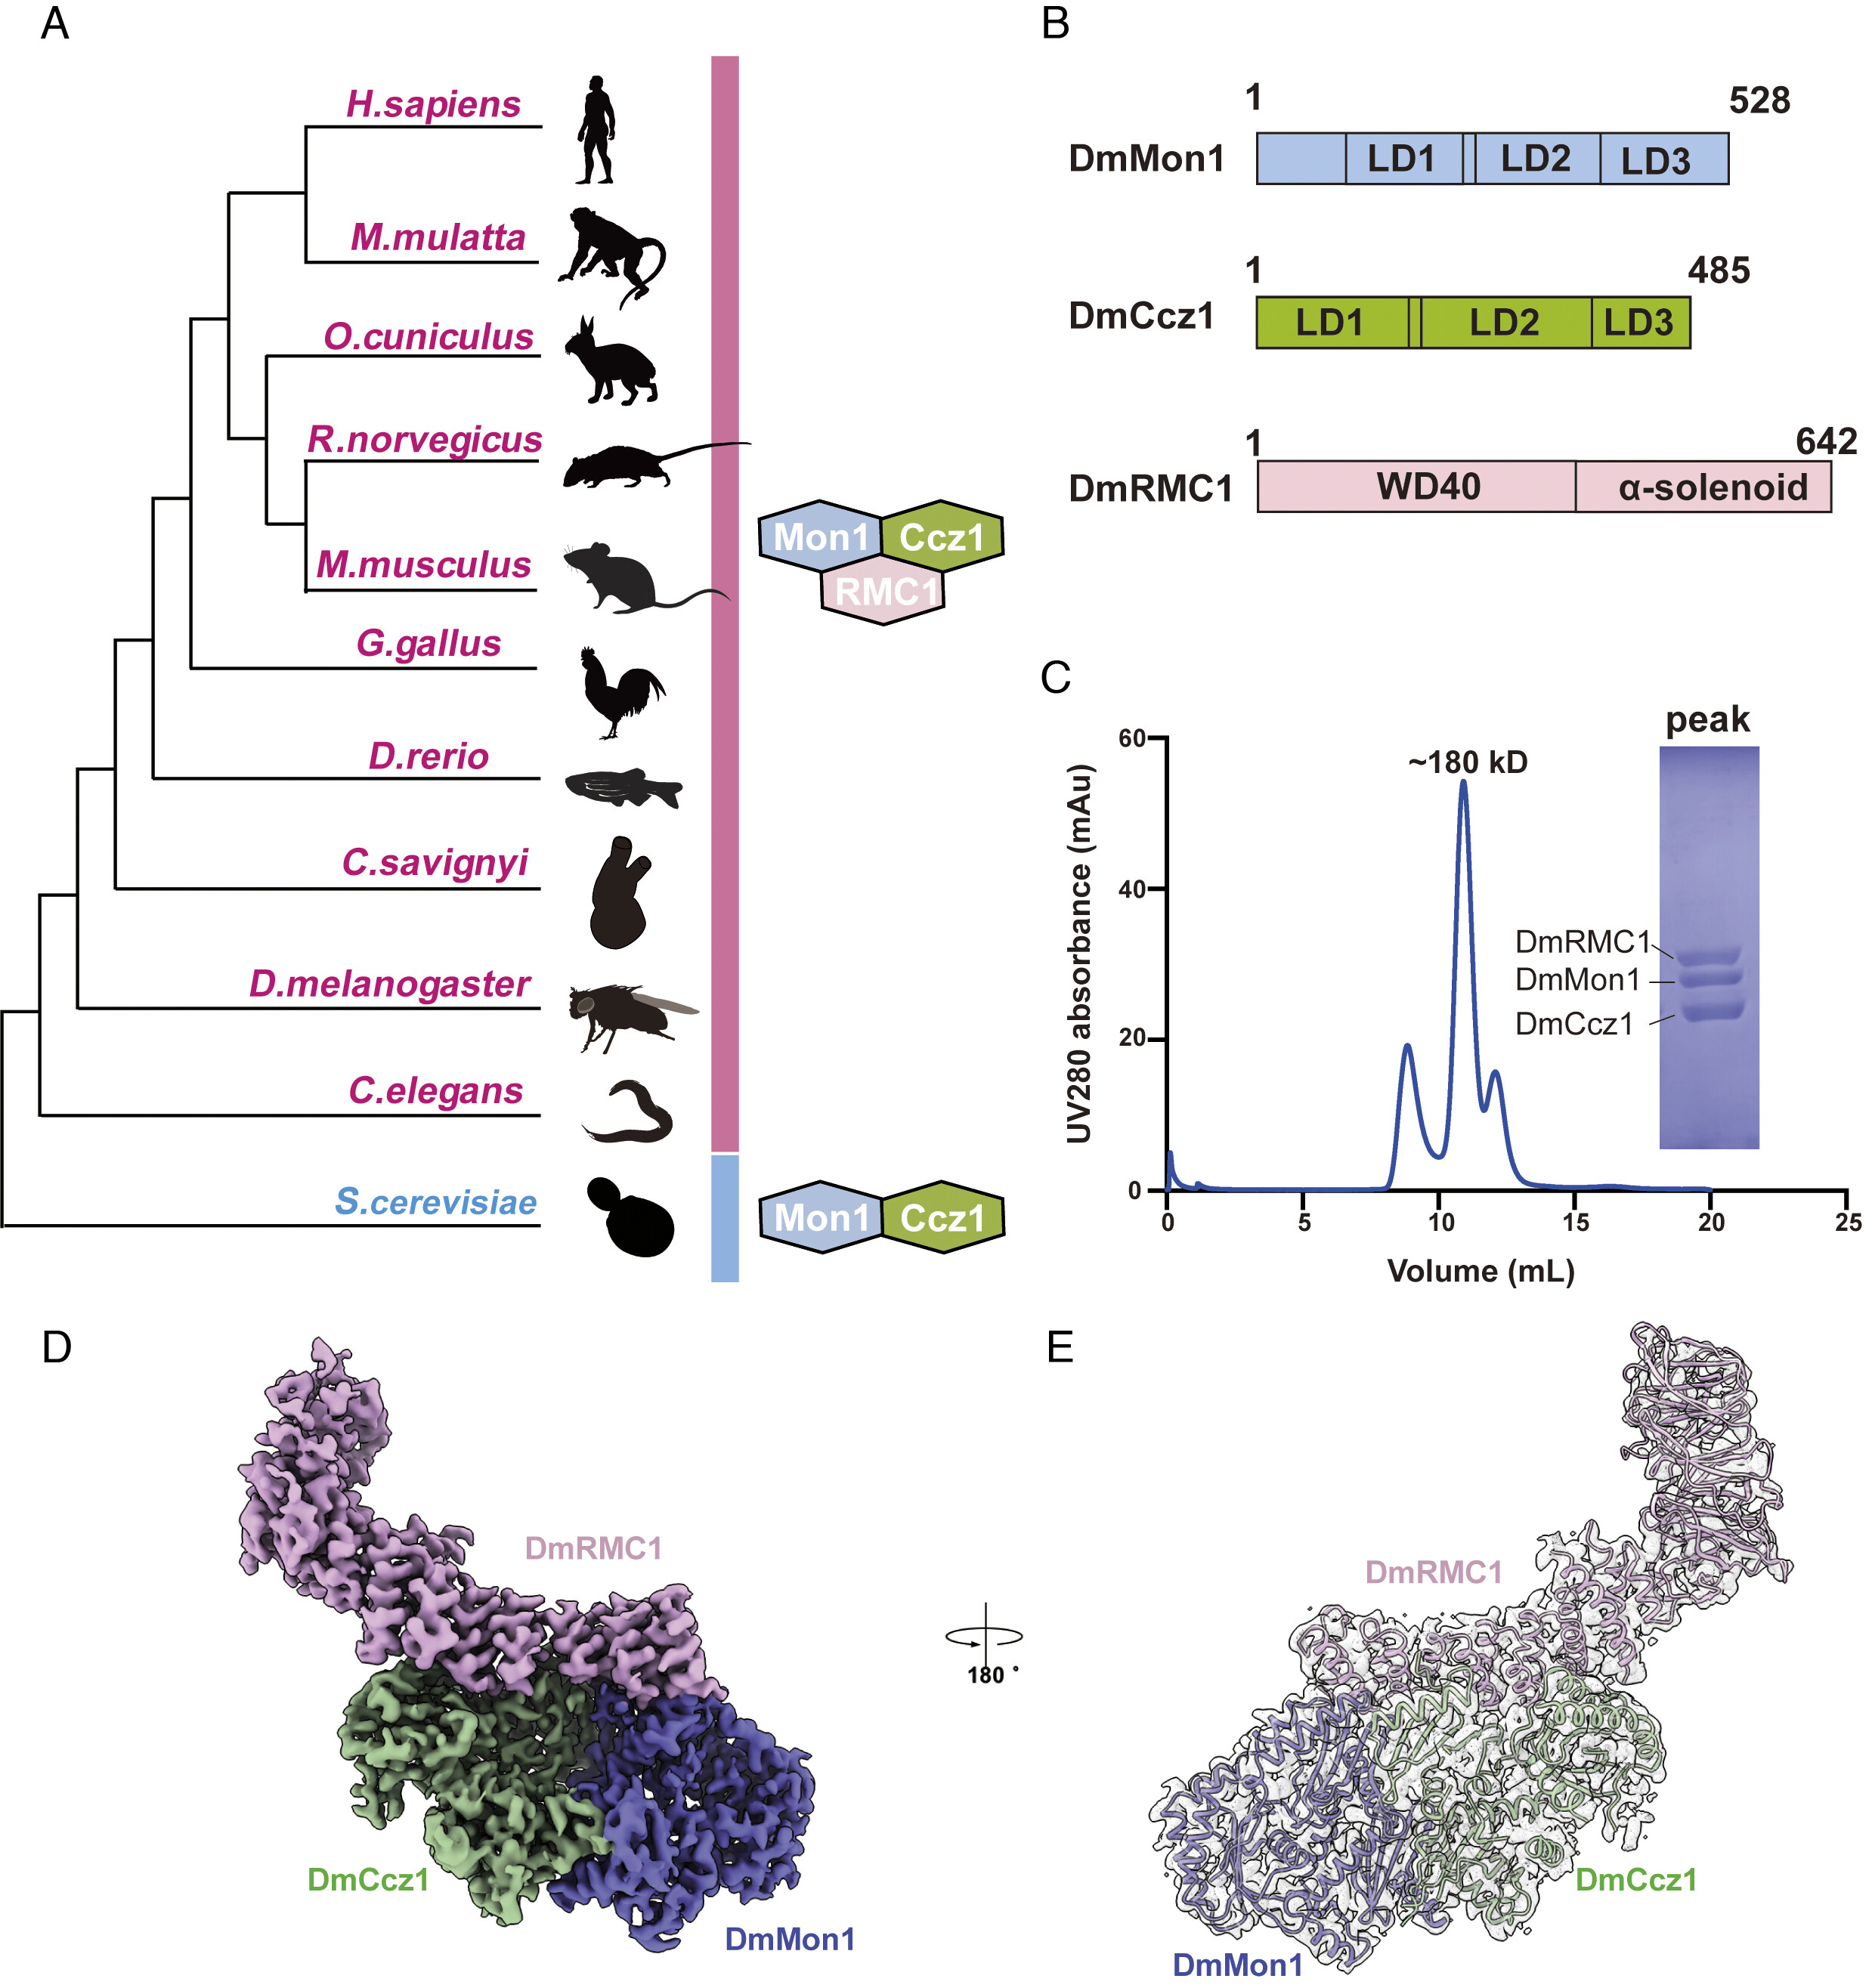
Fig. 1 Cryo-EM structure of the metazoan Mon1–Ccz1–RMC1 complex. (A) Cartoon representation incorporating the results of multiple phylogenetic analyses, including Mon1, Ccz1, and RMC1. The gene families that contain Mon1 and Ccz1 are present across eukaryotes, while RMC1 only exists in metazoans. (B) Schematic domain organization of DmMon1–Ccz1–RMC1 subunits. WD40, α-solenoid and LDs (LD1 to LD3) are indicated. Dm: D. melanogaster. (C) Gel filtration profile of DmMon1–Ccz1–RMC1 complex. The horizontal axis represents elution volume, and the vertical axis represents ultraviolet (UV) absorption. The peak and estimated molecular mass of targeted proteins are labeled. The Coomassie blue-stained sodium dodecyl sulfate–polyacrylamide gel electrophoresis (SDS/PAGE) gel shows the peak fraction of the DmMon1–Ccz1–RMC1 complex from gel filtration. (D) Final Cryo-EM map of the DmMon1–Ccz1–RMC1 complex is shown at 2.87 σ threshold with each subunit colored, respectively (pink for DmRMC1, blue for DmMon1 and green for DmCcz1). (E) Shown are the cryo-EM model and density (2.28 σ threshold) of the DmMon1–Ccz1–RMC1 complex.