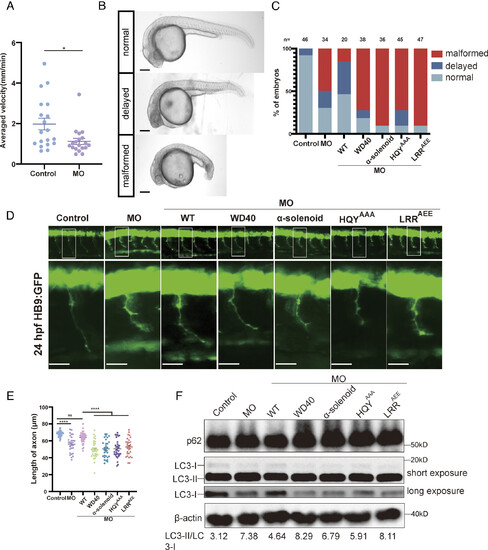
The Mon1-Ccz1-RMC1 assembly is critical for development and autophagic functions in zebrafish. (A) Motor abilities of zebrafish larvae injected with control MO (control) and RMC1 MO (MO) were monitored. Swimming abilities of larvae (control or MO) at 72 hpf (hours post fertilization) were recorded in a 48-well plate using the DanioVision system. The larvae were placed in a resting state for 5 min, then stimulated for 11 min by selected point magnifying sound waves. Each circle represents one larva. Error bars represent mean ± SE. About 19 larvae were used in each group. P values were calculated by Student's t test. *P < 0.05. (B) Classification of zebrafish embryos based on their developmental stage, body and tail morphology. Normal, similar to control fish; Delayed, moderately delayed; Malformed, significantly delayed, microcephalic and short-tailed. (Scale bar: 150 μm.) (C) Ratios of embryos in categories of normal, delayed and malformed, upon injection of MO or coinjection of different mRNAs. Control: control; MO: injection of RMC1 MO; MO+WT: coinjection of RMC1 MO and human RMC1 WT mRNA; MO+WD40: coinjection of MO and WD40 mRNA; MO+α-solenoid mRNA: coinjection of MO and α-solenoid mRNA; MO+HYQAAA: coinjection of MO and HYQAAA mRNA; MO+LRRAEE: coinjection of MO and LRRAEE mRNA. The number of embryos used for statistics are shown above each column. (D) CaP axon morphology from 24 hpf embryos injected with control MO, or RMC1 MO alone or together with different mRNAs indicated in (C) at one-cell stage (Top). Bottom: zoom-in views of white box from top pictures. All injections were performed on the Tg [Hb9: GFP]ml2 transgenic zebrafish embryos. (Scale bar: 25 μm.) (E) Statistical results of the length of CaP axons in embryos treated as in (D). For each group, approximately 30 to 40 axons were used for analysis. Error bars represent mean ± SE, ****P < 0.0001; ns, no significant. P values were calculated using one-way ANOVA, Tukey’s multiple comparisons test. (F) Immunoblotting analysis of LC3 and p62 protein levels in injected embryos and uninjected controls. The protein level of LC3 was detected via both long and short exposure. Embryos were injected with RMC1 MO alone or coinjected with mRNAs encoding RMC1 WT or indicated mutants. Protein samples were extracted at 24 hpf (>50 embryos/sample). The LC3-II/LC3-I ratio is shown below.
|
