
Fig. 4
- ID
- ZDB-FIG-231004-8
- Publication
- Yong et al., 2023 - Cryo-EM structure of the Mon1-Ccz1-RMC1 complex reveals molecular basis of metazoan RAB7A activation
- Other Figures
- All Figure Page
- Back to All Figure Page
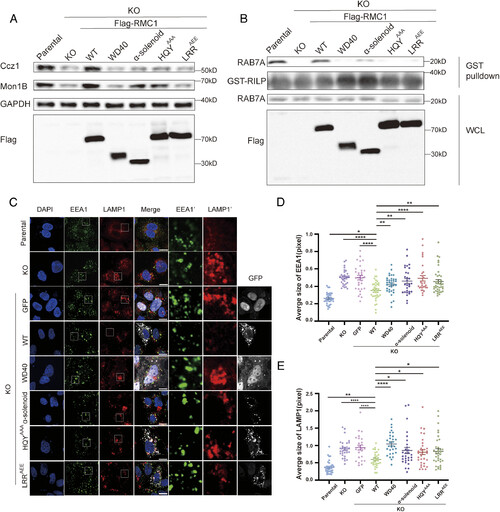
The Mon1-Ccz1-RMC1 assembly is required for cellular RAB7A activation and endolysosomal morphology. (A) Immunoblotting analysis of lysates from parental, RMC1 KO cells and RMC1 KO cells complemented with Flag-tagged RMC1 WT, WD40 (residues 1 to 370), α-solenoid (residues 354 to 642), Ccz1-binding-deficient mutant HQYAAA or Mon1-binding-deficient mutant LRRAEE. Mon1B, Ccz1, GAPDH, and RMC1 were detected by indicated antibodies. (B) GST-RILP was used to pulldown lysates from WT, RMC1 KO cells and RMC1 KO cells complemented with Flag-tagged RMC1 WT, WD40, α-solenoid, HQYAAA or LRRAEE mutants. The levels of endogenous RAB7A-GTP in the pull-down samples were analyzed by immunoblotting. RMC1, RAB7A, and GST-RILP were detected using the indicated antibodies respectively. WCL: whole-cell lysates. (C) Immunofluorescence analysis of WT, RMC1 KO cells and RMC1 KO cells transfected with GFP or indicated GFP-tagged RMC1 constructs. Nuclei were stained with DAPI, early endosomes were stained with an antibody against EEA1, and late endosomes/lysosomes were stained with an antibody against LAMP1. (Scale bar: 10 μm.) EEA1′ and LAMP1′ shows the zoom-in view of EEA1 and LAMP1 in white boxes. (D) The average size of early endosomes (EEA1 positive) per cell in (C) was measured using ImageJ. Error bars represent mean ± SE. Statistical difference was determined by Student’s t test between two selected groups. *P < 0.05, **P < 0.01, ****P < 0.0001. (E) The average size of late endosomes/lysosomes (LAMP1 positive) per cell in (C) was measured using ImageJ. Error bars represent mean ± SE. Statistical difference was determined by Student’s t test between two selected groups. *P < 0.05, **P < 0.01, ****P < 0.0001. |