
- Title
-
Fgf, Hh, and pax2a differentially regulate expression of pax5 and pou3f3b in vestibular and auditory maculae in the zebrafish otic vesicle
- Authors
- Tan, A.L., Christensen, S.E., Baker, A.K., Riley, B.B.
- Source
- Full text @ Dev. Dyn.
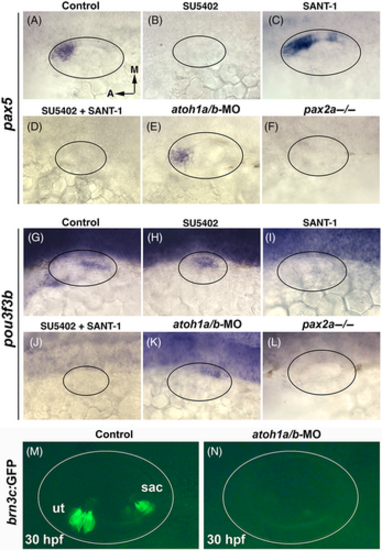
Effects of disrupting Fgf, Hh or early sensory development. Dorsolateral views of pax5 (A-F) and pou3f3b (G-L) at 24 hpf under conditions listed at the top. (A-D, G-J) Drug treatments were administered at 12 hpf to inhibit Fgf (70 μM SU5402) or Hh (150 μM SANT-1). The same treatment conditions were used in subsequent figures unless otherwise noted. (E, K) atoh1a-MO and atoh1b-MO were co-injected at the one-cell stage. (F, L) expression in pax2a−/− mutants. (M, N) Live images showing brn3c:Gfp expression in hair cells at 30 hpf in a wild-type embryo (M) and an atoh1a-atoh1b double morphant (N). Oval marquees denote the outer edge of the otic vesicle in this and all subsequent figures. |
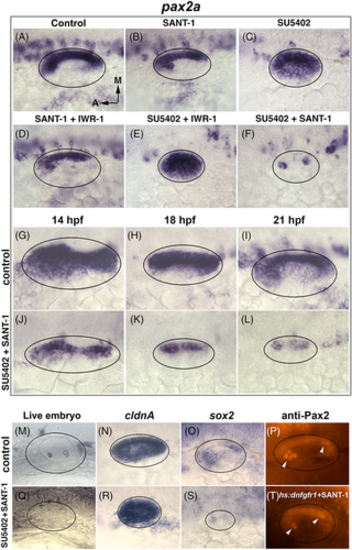
Critical roles for Fgf and Hh in regulating pax2a and sensory development. (A-T) Dorsolateral views of the otic placode or vesicle at various stages. (A-F) Images showing pax2a expression at 24 hpf following treatment at 12 hpf with inhibitors for Hh, Wnt, and Fgf (listed at top). IWR-1 (10 μM) was used to block Wnt. (G-L) Time course of pax2a expression in wild-type (DMSO treated) or SU5402 + SANT-1 treated embryos. Drugs were administered at 12 hpf and embryos were fixed at the timepoints listed at top. (M, Q) Images of live embryos at 24 hpf following treatment with DMSO (control) or SU5402 + SANT-1. (N, R) Expression of cldnA at 24 hpf in control and drug treated embryos. (O, S) Expression of sox2 at 24 hpf in control and drug treated embryos. (P, T) Anti-Pax2 staining at 30 hpf after blocking Fgf and Hh. Here Fgf was blocked by activating hs:dnfgfr1 to avoid intense background fluorescence caused by SU5402. Embryos were heat shocked at 12 hpf for 1 h at 39°C followed by immediate addition of SANT-1 (150 μM). Arrowheads mark elevated staining in tether cell nuclei. |
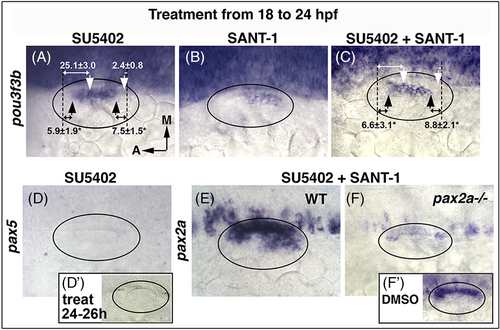
Disruption of Fgf and Hh after 18 hpf. (A-F) Inhibitors listed at the top were added at 18 hpf and expression of the indicated genes was examined at 24 hpf, except (D') in which SU5402 was added at 24 hpf and pax5 expression was examined at 26 hpf. Oval marquee denotes outer edge of the otic vesicle. White arrows (A, C) mark the normal boundaries of pou3f3b expression, black arrows mark altered boundaries in treated embryos. Black dashed lines mark positions of the anterior and posterior boundaries of the lumen, and distances in μm (mean ± SD) from the edges of the pou3f3b domain are indicated. Asterisks indicate statistically significant differences relative to the control. |
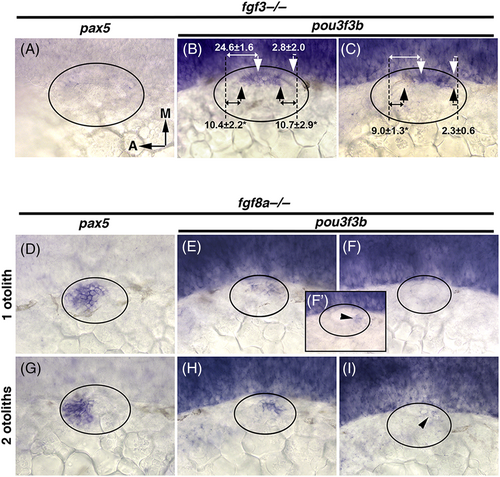
Effects of disrupting fgf3 or fgf8a. (A-I) Dorsolateral views showing expression of pax5 and pou3f3b at 24 hpf in fgf3−/− and fgf8a−/− mutants, as indicated at the top. White arrows (B, C) mark boundaries of pou3f3b normally seen in wild-type embryos, black arrows mark altered boundaries observed in fgf3−/− mutants, and dashed lines mark positions of the anterior and posterior boundaries of the lumen. Distances in μm separating the edges of the pou3f3b domain from that anterior and posterior poles are indicated. Asterisks indicate significant differences from the control. (D-I) fgf8a−/− mutants with one or two otoliths per ear, as indicated on the side, were analyzed separately. |
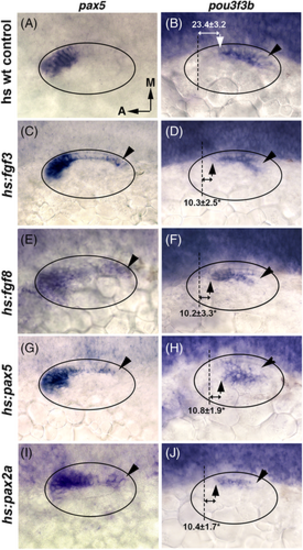
Effects of elevating levels of Fgf or Pax2/5 expression. (A-J) Dorsolateral views showing expression of pax5 and pou3f3b at 24 hpf following heat shock at 18 hpf (1 h at 39°C) in wild-type controls or heat shock-inducible transgenic lines as indicated at left. Note, transgene activation is transient such that transcript levels return to baseline after ~4 h. Hence activation of hs:pax5 at 18 hpf does not interfere with detection of endogenous pax5 at 24 hpf. Black arrowheads denote areas of ectopic pax5 expression and corresponding areas of pou3f3b repression. Distances in μm between the anterior boundary of the lumen (dashed lines) and the pou3f3b domain are indicated. Asterisks denote significant differences from wt control embryos. |
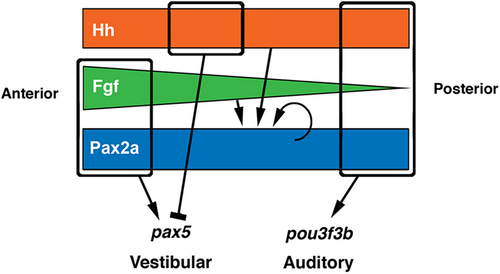
Model of differential regulation of pax5 and pou3f3b. Colored regions represent distributions of upstream factors necessary for regulating pax5 and pou3f3b in the utricular and saccular maculae, respectively. Hh and Pax2a are expressed uniformly along the AP axis, while Fgf is expressed in a gradient. Rounded rectangular marquees indicate combinations of factors required to activate (arrows) or repress (bar) expression. Expression of pax2a is maintained by partially redundant activities of Hh, Fgf, and Pax2a itself. |