
|
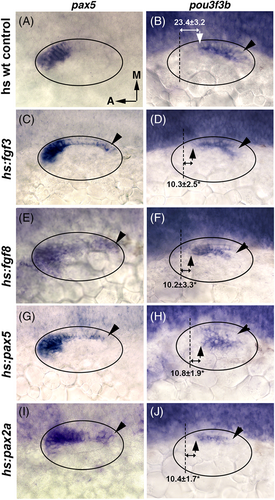
Fig. 5 Effects of elevating levels of Fgf or Pax2/5 expression. (A-J) Dorsolateral views showing expression of pax5 and pou3f3b at 24 hpf following heat shock at 18 hpf (1 h at 39°C) in wild-type controls or heat shock-inducible transgenic lines as indicated at left. Note, transgene activation is transient such that transcript levels return to baseline after ~4 h. Hence activation of hs:pax5 at 18 hpf does not interfere with detection of endogenous pax5 at 24 hpf. Black arrowheads denote areas of ectopic pax5 expression and corresponding areas of pou3f3b repression. Distances in μm between the anterior boundary of the lumen (dashed lines) and the pou3f3b domain are indicated. Asterisks denote significant differences from wt control embryos.