
- Title
-
CIGB-258 Exerts Potent Anti-Inflammatory Activity against Carboxymethyllysine-Induced Acute Inflammation in Hyperlipidemic Zebrafish via the Protection of Apolipoprotein A-I
- Authors
- Cho, K.H., Nam, H.S., Kim, J.E., Na, H.J., Del Carmen Dominguez-Horta, M., Martinez-Donato, G.
- Source
- Full text @ Int. J. Mol. Sci.

Glycation of HDL3 (2 mg/mL) by treatment of carboxymethyllysine (CML) and fructose (fruc) at 37 °C in the presence of 5% CO2. (A) Comparison of fluorescence intensity (Ex = 370 nm, Em = 440 nm) from the glycated product in HDL3 (200 μg) with the treatment of either CML (final 0, 100, 200, and 400 μM) or fructose (final 0 and 400 μM) during 144 h The data are expressed as mean ± SEM from three independent measurements with duplicate samples. *, p < 0.05; **, p < 0.01; ***, p < 0.001. (B) Electrophoretic patterns (15% SDS-PAGE) of glycated HDL3 with the treatment of either CML (final 0, 100, 200, and 400 μM) or fructose (final 0 and 400 μM) at 144 h. Five micrograms of total protein in HDL3 was equally applied to each lane. Red font indicates band intensity from three independent SDS-PAGE analyses. Lane N, native HDL3; lane M, molecular weight marker (Bio-Rad, prestained low-range). |
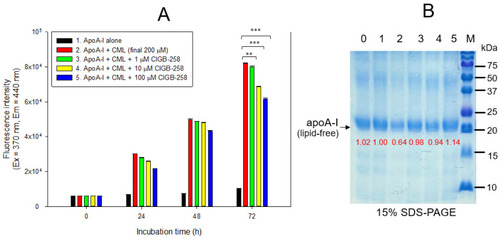
Glycation extent of apoA-I in the lipid-free state by carboxymethyllysine (CML) in the presence and absence of CIGB-258. (A) Measurement of the fluorescence intensity (Ex = 370 nm, Em = 440 nm) of apoA-I during 72 h incubation. The data are expressed as mean ± SEM from three independent measurements with duplicate samples. **, p < 0.01; ***, p < 0.001. (B) Electrophoretic patterns of the apoA-I after 72 h incubation (15% SDS-PAGE). Seven μg of protein in apoA-I was equally applied to each lane. Lane 0, apoA-I alone; lane 1, apoA-I (1 mg/mL) + PBS; lane 2, apoA-I + CML (final 200 μM); lane 3, apoA-I + CML + CIGB-258 (final 1 μM); lane 4, apoA-I + CML + CIGB-258 (final 10 μM); lane 5, apoA-I + CML + CIGB-258 (final 100 μM); lane M, molecular weight marker (Bio-Rad, pre-stained low-range). |

Comparison of apoA-I structure and antioxidant ability in the presence of carboxymethyllysine (CML) and CIGB-258. (A) Measurement of the wavelength maximum fluorescence of the Trp emission scanning spectrum (Ex = 295 nm, Em = 305–400 nm) during 48 h incubation with apoA-I and CML under the absence or presence of CIGB-258. The data are expressed as mean ± SEM from three independent measurements with duplicate samples. ***, p < 0.001 versus apoA-I alone. (B) Measurement of ferric ion reduction ability (FRA) with apoA-I during 60 min incubation with CML and CIGB-258. **, p < 0.01 versus PBS + apoA-I + CML; ***, p < 0.001 versus PBS + apoA-I + CML; ns, not significant. |

Immunostaining of interleukin (IL)-6 with zebrafish embryo and survivability after microinjection of apoA-I (28 ng) or CIGB-258 (1 ng) with CML (500 ng) and into zebrafish embryo at 1 h post-fertilization. (A) Immunofluorescence image of immunostained with anti-IL-6 antibody (ab208113, Abcam London, UK) as primary antibody (1:100 diluted) and goat anti-Rabbit IgG H&L (Alexa Fluor® 488, ab150077, Abcam, London, UK) as a secondary antibody (1:300 diluted) at 24 h post-injection. a. PBS alone; b. CML + PBS; c. CML + apoA-I; d. CML + CIGB-258. (B) Calculation of the immunostained fluorescence area (left axis) using Image J software version 1.53r (http://rsb.info.nih.gov/ij/ accessed on 16 January 2023) to convert the green intensity from the immunostaining. Survivability of the embryo at 24 h post-injection was also presented as the right axis. **, p < 0.01; ***, p < 0.001 of the immunofluorescence. #, p < 0.05 versus PBS + CML; ##, p < 0.01 versus PBS + CML of the survivability. |
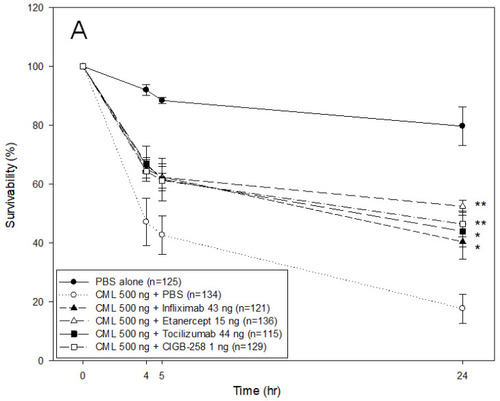
Comparison of the protective activity of monoclonal antibodies and CIGB-258 against carboxymethyllysine (CML, final 500 ng) toxicity in zebrafish embryos. (A) Survivability of zebrafish embryos during 24 h post-injection in the presence of Infliximab (43 ng), Etanercept (15 ng), Tocilizumab (44 ng), or CIGB-258 (final 1 ng). *, p < 0.05; **, p < 0.01. (B) Stereo image of the zebrafish embryos at 5 h and 24 h post-injection. The red arrowheads indicate defective development and death of embryos in the CML alone group (photograph b). The blue arrowhead indicates the slowest developmental speed in eye pigmentation and tail elongation in CML alone group at 24 h post-injection (photograph c). Fluorescence image of dihydroethidium (DHE, Ex = 585 nm, Em = 615 nm) stained and acridine orange (AO, Ex = 505 nm, Em = 535 nm) stained embryo at 5 h post-injection. The extent of ROS production and apoptosis was visualized by DHE and AO staining, respectively. The white arrow indicates the CML-injected site to show that ROS production and cellular apoptosis occurred simultaneously by acute inflammation. Photo a, PBS alone; photo b, CML + PBS; photo c, CML + Infliximab; photo d, CML + Etanercept; photo e, CML + Tocilizumab; photo f, CML + CIGB-258 (C) Quantification of the fluorescence from DHE-stained and AO-stained embryo images using Image J software version 1.53r (http://rsb.info.nih.gov/ij/ accessed on 17 January 2023). AU, arbitrary unit; NS, not significant. |

Comparison of the protective activity of monoclonal antibodies and CIGB-258 against carboxymethyllysine (CML, final 500 ng) toxicity in zebrafish embryos. (A) Survivability of zebrafish embryos during 24 h post-injection in the presence of Infliximab (43 ng), Etanercept (15 ng), Tocilizumab (44 ng), or CIGB-258 (final 1 ng). *, p < 0.05; **, p < 0.01. (B) Stereo image of the zebrafish embryos at 5 h and 24 h post-injection. The red arrowheads indicate defective development and death of embryos in the CML alone group (photograph b). The blue arrowhead indicates the slowest developmental speed in eye pigmentation and tail elongation in CML alone group at 24 h post-injection (photograph c). Fluorescence image of dihydroethidium (DHE, Ex = 585 nm, Em = 615 nm) stained and acridine orange (AO, Ex = 505 nm, Em = 535 nm) stained embryo at 5 h post-injection. The extent of ROS production and apoptosis was visualized by DHE and AO staining, respectively. The white arrow indicates the CML-injected site to show that ROS production and cellular apoptosis occurred simultaneously by acute inflammation. Photo a, PBS alone; photo b, CML + PBS; photo c, CML + Infliximab; photo d, CML + Etanercept; photo e, CML + Tocilizumab; photo f, CML + CIGB-258 (C) Quantification of the fluorescence from DHE-stained and AO-stained embryo images using Image J software version 1.53r (http://rsb.info.nih.gov/ij/ accessed on 17 January 2023). AU, arbitrary unit; NS, not significant. |
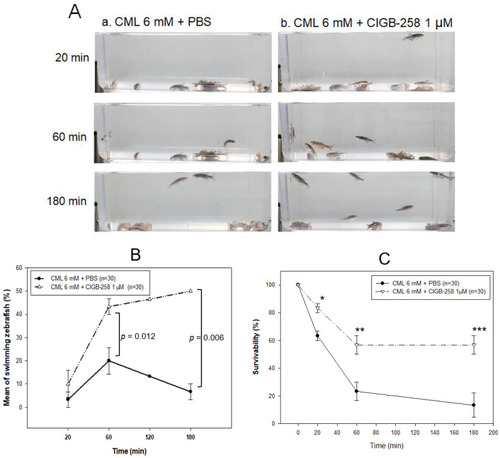
Comparison of the swimming ability after an injection of carboxymethyllysine (CML) with or without CIGB-258. (A) Still image of swimming pattern of zebrafish after 20 min, 60 min, and 180 min post-injection of CML (500 μg) + PBS (photograph a) and CML (500 μg) + CIGB-258 (1 μg, photograph b) per fish. (B) Percentage of swimming zebrafish after 20 min, 60 min, and 180 min post-injection of CML (500 μg) + PBS and CML (500 μg) + CIGB-258 (1 μg). (C) Survivability at 20 min, 60 min, and 180 min post-injection of CML (500 μg) + PBS and CML (500 μg) + CIGB-258 (1 μg). *, p < 0.05; **, p < 0.01; ***, p < 0.001. |

Histologic analysis of hepatic tissue. The zebrafish were injected with carboxymethyllysine (CML) in the presence or absence of CIGB-258 under the consumption of a high-cholesterol diet (HCD). (A) Visualization of the infiltration of neutrophils by Hematoxylin & Eosin (H&E) staining as shown in the left photographs (photographs a, b, c). The right photographs show the conversion of the Hematoxylin-stained area into red intensity (photographs d, e, f). (B) Quantification graph of the nucleus area from H&E staining using Image J software version 1.53r (http://rsb.info.nih.gov/ij/ (accessed on 17 January 2023)) as shown in red intensity. The cell infiltration area was quantified as a percentage of the total hepatocyte area, as determined in H&E-stained sections. The scale bar indicates 100 μm. |

Comparisons of the fatty liver changes and reactive oxygen species (ROS) by Oil red O staining and dihydroethidium (DHE) staining, respectively. (A) Representative image of oil red O-stained and DHE-stained hepatic tissue at 180 min post-injection. The scale bar indicates 100 μm. (B) Quantification of the oil red O intensity and DHE fluorescence (Ex = 585 nm, Em = 615 nm) intensity using Image J software version 1.53r (http://rsb.info.nih.gov/ij/ accessed on 16 September 2022). |
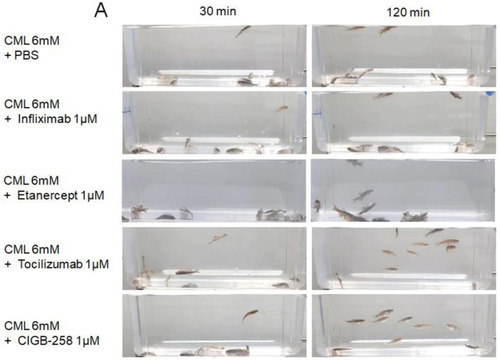
Comparison of the swimming ability and survivability after an intraperitoneal injection of carboxymethyllysine (CML) with Infliximab (Remsima), Etanercept (Enbrel), Tocilizumab (Actemra), or CIGB-258 (Jusvinza). (A) Still image of the swimming pattern of zebrafish 30 min and 120 min post-injection of CML with Infliximab (Remsima), Etanercept (Enbrel), Tocilizumab (Actemra), or CIGB-258 (Jusvinza) 30 min and 120 min post-injection. (B) Survivability of the zebrafish at 180 min post-injection of CML with Infliximab (Remsima), Etanercept (Enbrel), Tocilizumab (Actemra), or CIGB-258 (Jusvinza). *, p < 0.05 versus CML + PBS; ***, p < 0.001 versus CML + PBS. (C) Percentage of swimming zebrafish after an injection of CML with Infliximab (Remsima), Etanercept (Enbrel), Tocilizumab (Actemra), or CIGB-258 (Jusvinza) at 30 min, 60 min, and 120 min post-injection. *, p < 0.05 versus CML + PBS; ***, p < 0.001 versus CML + PBS. |

Comparison of the swimming ability and survivability after an intraperitoneal injection of carboxymethyllysine (CML) with Infliximab (Remsima), Etanercept (Enbrel), Tocilizumab (Actemra), or CIGB-258 (Jusvinza). (A) Still image of the swimming pattern of zebrafish 30 min and 120 min post-injection of CML with Infliximab (Remsima), Etanercept (Enbrel), Tocilizumab (Actemra), or CIGB-258 (Jusvinza) 30 min and 120 min post-injection. (B) Survivability of the zebrafish at 180 min post-injection of CML with Infliximab (Remsima), Etanercept (Enbrel), Tocilizumab (Actemra), or CIGB-258 (Jusvinza). *, p < 0.05 versus CML + PBS; ***, p < 0.001 versus CML + PBS. (C) Percentage of swimming zebrafish after an injection of CML with Infliximab (Remsima), Etanercept (Enbrel), Tocilizumab (Actemra), or CIGB-258 (Jusvinza) at 30 min, 60 min, and 120 min post-injection. *, p < 0.05 versus CML + PBS; ***, p < 0.001 versus CML + PBS. |

Histologic analysis of the hepatic tissue from zebrafish injected with PBS alone (photograph a), CML+ PBS (photograph b), CML+ Infliximab (photograph c), CML + Etanercept (photograph d), CML + Tocilizumab (photograph e), and CML + CIGB-258 (photograph f) under the consumption of a high cholesterol diet (HCD). (A) Photographs show the infiltration of neutrophils by Hematoxylin & Eosin (H&E) staining after converting the Hematoxylin-stained area into a red intensity. The yellow scale bar indicates 100 μm. The red box area in image of 400× magnification was observed again at 1000× magnification (B) Quantification of the nucleus area from the H&E staining using Image J software version 1.53r (http://rsb.info.nih.gov/ij/ accessed on 15 September 2022). The statistical significance of the groups was indicated as p-values at the top of the graph. |
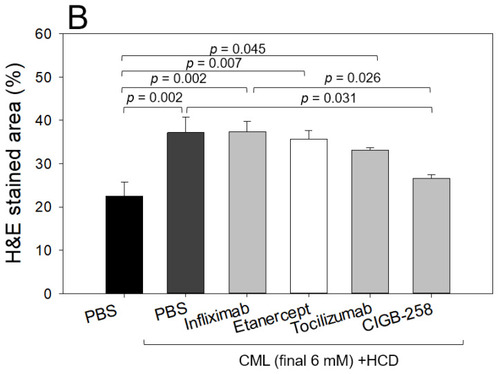
Histologic analysis of the hepatic tissue from zebrafish injected with PBS alone (photograph a), CML+ PBS (photograph b), CML+ Infliximab (photograph c), CML + Etanercept (photograph d), CML + Tocilizumab (photograph e), and CML + CIGB-258 (photograph f) under the consumption of a high cholesterol diet (HCD). (A) Photographs show the infiltration of neutrophils by Hematoxylin & Eosin (H&E) staining after converting the Hematoxylin-stained area into a red intensity. The yellow scale bar indicates 100 μm. The red box area in image of 400× magnification was observed again at 1000× magnification (B) Quantification of the nucleus area from the H&E staining using Image J software version 1.53r (http://rsb.info.nih.gov/ij/ accessed on 15 September 2022). The statistical significance of the groups was indicated as p-values at the top of the graph. |
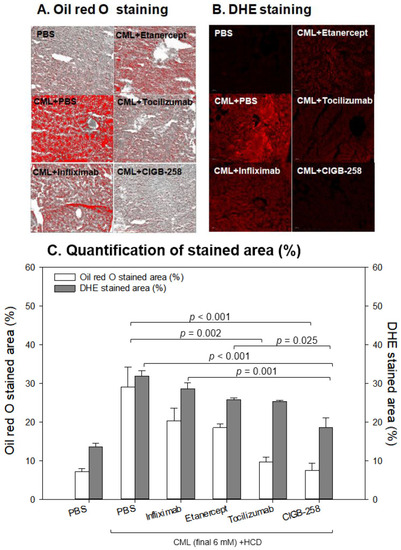
Comparisons of the fatty liver changes (A) and production of reactive oxygen species (ROS) (B) by Oil red O staining and dihydroethidium (DHE) staining, respectively, among each drug-injected zebrafish. (A) Representative image of oil red O-stained hepatic tissue to show fatty liver changes. The scale bar indicates 100 μm. (B) Representative fluorescence (Ex = 585 nm, Em = 615 nm) image of DHE-stained hepatic tissue to show ROS production. The scale bar indicates 100 μm. (C) Quantification of the oil red O intensity and DHE fluorescence intensity using Image J software version 1.53r (http://rsb.info.nih.gov/ij/ accessed on 15 September 2022). |

Comparisons of the IL-6-stained area from immunohistochemistry (IHC) among each drug-injected zebrafish. (A) Representative image of IHC using IL-6 antibody-stained hepatic tissue. The scale bar indicates 100 μm. (B) Quantification of IL-6 antibody-stained area with brown intensity using Image J software version 1.53r (http://rsb.info.nih.gov/ij/ accessed on 14 October 2022). |

Quantification of lipid profiles from zebrafish injected with PBS, Infliximab, Etanercept, Tocilizumab, and CIGB-258, in the presence of CML under a high cholesterol diet (HCD). *, p < 0.05 versus PBS (CML-alone) group; **, p < 0.01 versus PBS (CML-alone) group. All zebrafish were sacrificed at 180 min post-injection of each designated drug. (A) Quantification of the total cholesterol (TC) levels of zebrafish plasma at 180 min post-injection. (B) Quantification of the triglyceride (TG) levels of zebrafish plasma at 180 min post-injection. |