
Image
|
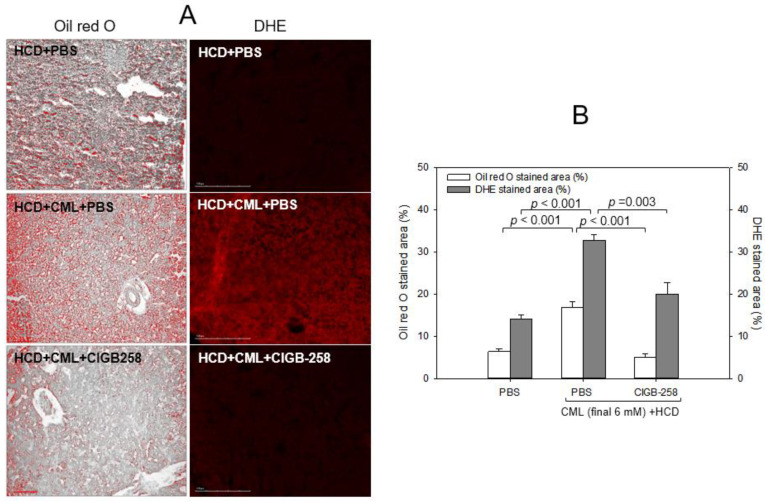
Figure Caption
Figure 8
Comparisons of the fatty liver changes and reactive oxygen species (ROS) by Oil red O staining and dihydroethidium (DHE) staining, respectively. (A) Representative image of oil red O-stained and DHE-stained hepatic tissue at 180 min post-injection. The scale bar indicates 100 μm. (B) Quantification of the oil red O intensity and DHE fluorescence (Ex = 585 nm, Em = 615 nm) intensity using Image J software version 1.53r (http://rsb.info.nih.gov/ij/ accessed on 16 September 2022).
Acknowledgments
This image is the copyrighted work of the attributed author or publisher, and
ZFIN has permission only to display this image to its users.
Additional permissions should be obtained from the applicable author or publisher of the image.
Full text @ Int. J. Mol. Sci.