
- Title
-
Behavioural, genomics and proteomic approach to examine Alzheimer's disease in zebrafish
- Authors
- Siddiqui, A., Abidin, S.A.Z., Shah, Z.A., Othman, I., Kumari, Y.
- Source
- Full text @ Comp. Biochem. Physiol. C Toxicol. Pharmacol.
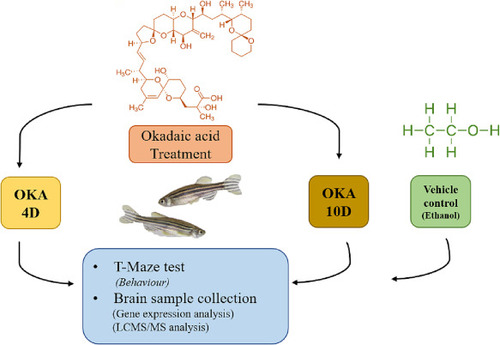
Schematic presentation of experimental design: OKA 4D (4 days Okadaic acid treated fish); OKA 10D (10 days Okadaic acid treated fish). |
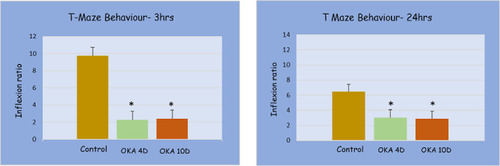
Inflexion ratio for 4D and 10D OKA treated group and control group: Inflexion ratio in T-maze in different experimental groups at 3 h and 24 h. Data expressed as mean ± SEM. n = 18. *p < 0.05 for inflexion ratio when compared with the control group using unpaired parametric student's t-test. PHENOTYPE:
|
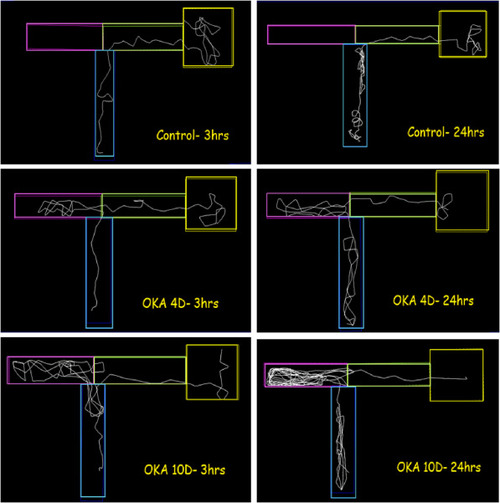
Zebrafish T-maze trajectory pattern. PHENOTYPE:
|
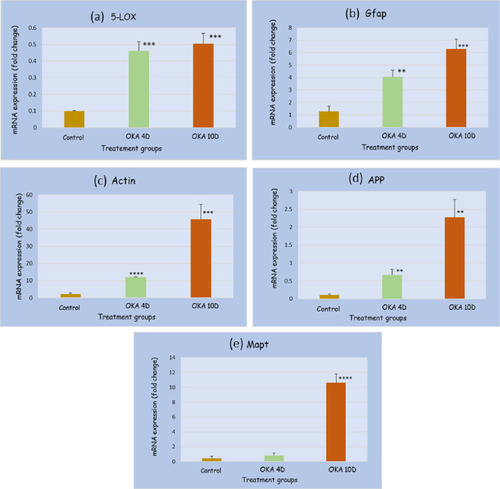
mRNA expression levels for 4-day and 10-day OKA treated group, and control group: Data expressed as mean ± SEM. n = 18. ****P < 0.0001, ***P < 0.001,**P < 0.01 when compared with the control group using unpaired parametric student’s t-test. |
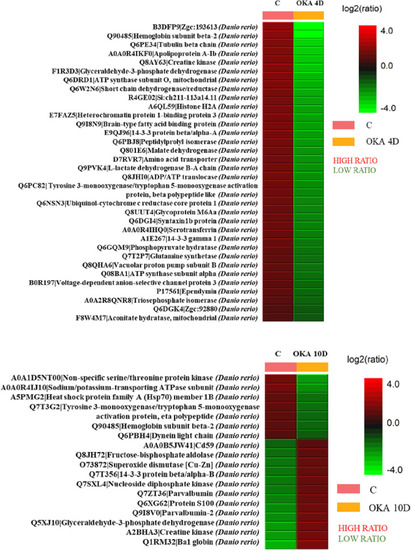
Differential protein expression in LFQ expressed by heatmap of normal control vs AD models (OKA 4D and OKA 10D). Proteins with a high and low ratio are mentioned in red and green colour respectively. The pink line indicates the control group, and the yellow line indicates OKA groups (OKA 4D and OKA 10D). |
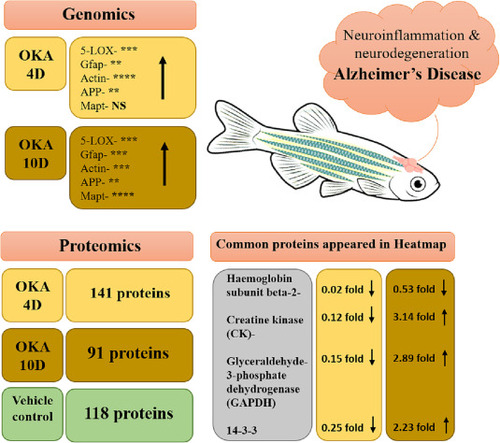
4 days OKA treated fish (OKA 4D); 10 days OKA treated fish (OKA 10D); 5-Lipoxygenase (5-LOX); Glial fibrillary acidic protein (Gfap); Amyloid precursor protein (APP); Microtubule-associated protein tau (Mapt); Not significant (NS); ** (P < 0.01); ***(P < 0.001); **** (P < 0.0001). |