
FIGURE
Fig. 2
- ID
- ZDB-FIG-231207-2
- Publication
- Siddiqui et al., 2023 - Behavioural, genomics and proteomic approach to examine Alzheimer's disease in zebrafish
- Other Figures
- All Figure Page
- Back to All Figure Page
Fig. 2
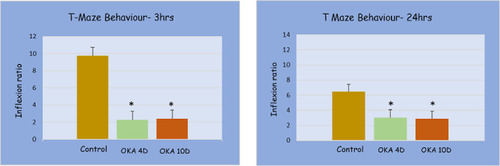
Inflexion ratio for 4D and 10D OKA treated group and control group: Inflexion ratio in T-maze in different experimental groups at 3 h and 24 h. Data expressed as mean ± SEM. n = 18. *p < 0.05 for inflexion ratio when compared with the control group using unpaired parametric student's t-test. |
Expression Data
Expression Detail
Antibody Labeling
Phenotype Data
| Fish: | |
|---|---|
| Condition: | |
| Observed In: | |
| Stage: | Adult |
Phenotype Detail
Acknowledgments
This image is the copyrighted work of the attributed author or publisher, and
ZFIN has permission only to display this image to its users.
Additional permissions should be obtained from the applicable author or publisher of the image.
Full text @ Comp. Biochem. Physiol. C Toxicol. Pharmacol.