
FIGURE
Fig. 5
- ID
- ZDB-FIG-231207-5
- Publication
- Siddiqui et al., 2023 - Behavioural, genomics and proteomic approach to examine Alzheimer's disease in zebrafish
- Other Figures
- All Figure Page
- Back to All Figure Page
Fig. 5
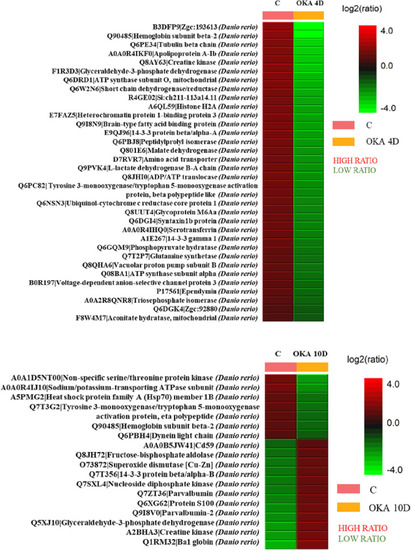
Differential protein expression in LFQ expressed by heatmap of normal control vs AD models (OKA 4D and OKA 10D). Proteins with a high and low ratio are mentioned in red and green colour respectively. The pink line indicates the control group, and the yellow line indicates OKA groups (OKA 4D and OKA 10D). |
Expression Data
Expression Detail
Antibody Labeling
Phenotype Data
Phenotype Detail
Acknowledgments
This image is the copyrighted work of the attributed author or publisher, and
ZFIN has permission only to display this image to its users.
Additional permissions should be obtained from the applicable author or publisher of the image.
Full text @ Comp. Biochem. Physiol. C Toxicol. Pharmacol.