
- Title
-
Zebrafish (Danio rerio) larvae as a predictive model to study gentamicin-induced structural alterations of the kidney
- Authors
- Bolten, J.S., Tanner, C., Rodgers, G., Schulz, G., Levano, S., Weitkamp, T., Waldner, S., Puligilla, R.D., Bodmer, D., M�ller, B., Huwyler, J.
- Source
- Full text @ PLoS One

Analytical technologies, workflow, and outcome.
Summary of employed imaging strategies to study toxic effects using zebrafish pronephros and mouse kidney biopsies. Methods include confocal laser scanning microscopy, synchrotron radiation-based computed tomography (SR?CT), and semiquantitative image analysis of H&E/PAS stained histology slides. |

Gentamicin-induced damage to the pronephros in 96 hpf Tg(wt1b:eGFP) ZFL.
(A) Schematic representation of renal pronephros in 96 hpf ZFL. GL: glomerulus, PT: proximal convoluted and straight tubule, DT: distal early and late tubule. Pronephros are fused together at the midline above the yolk and heart. Transgenic expression of eGFP leads to a fluorescent signal (green) in the glomerulus and upper parts of the tubules. (B) 72 hpf Tg(wt1b:eGFP) ZFL were injected with 1 nL of 14.4 mM to 42 mM gentamicin. Representative images of maximum projections. The color-coded heat map indicates SI, e.g. white correlates to high SI values and black to weak SI. Scale bar: 25 ?m. Gent: gentamicin. (C) Relative SI and relative volume of the glomerulus (panel B, white dotted rectangle) as compared to normalized control is shown using a box-and-whisker plot, n ? 10 ZFL. *p < 0.001, **p < 0.05. |

Synchrotron radiation-based computed tomography (SR?CT) of control and gentamicin-treated ZFL.
(A) 3D renderings of 96 hpf ZFL at 24 hpi of 1 nL of control buffer (left panels) or 1 nL of 42 mM gentamicin (right panels) with sagittal cuts. Pixel size: 0.65 ?m. Anatomical structures: 1 = eye lens, 2 = mouth, 3 = muscle tissues, 4 = optical nerve, 5 = otoliths, 6 = liver, 7 = notochord, 8 = hindbrain, 9 = midbrain, 10 = frontbrain, 11 = intestine, 12 = heart. (B) Representative virtual slices through the heart chambers (yellow reticle) of control (left) and 1 nL of 42 mM gentamicin (right) treated ZFL. Scale bar: 100 ?m. |
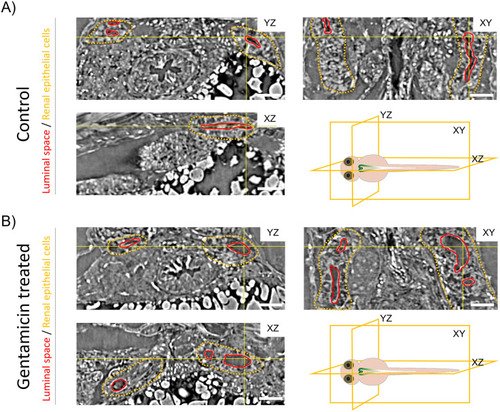
Microtomography-based visualization of the ZFL pronephros.
(A) Orthogonal sections from the 4 dpf ZFL through the microtomography volume of PBS (control) and treated with 1 nL of 42 mM gentamicin (24 hour incubation). Yellow lines show the position of the virtual slices, which intersect at the reticle point located in the luminal space. Luminal space is outlined in red, renal epithelial cells are in yellow. Schematic illustrations indicate the cutting planes. Scale bar: 100 ?m. |
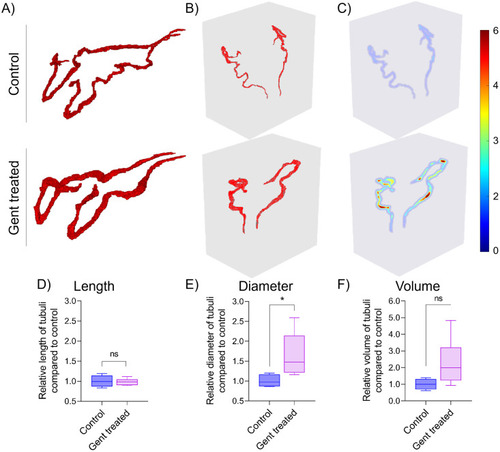
SR?CT-based reconstruction and quantification of ZFL proximal tubules.
Rendered proximal renal tubules of control and gentamicin-treated ZFL (1 nL of 42 mM gentamicin, analysis 24 hpi) are shown in (A) lateral and (B) ventral projection. (C) Color-coded heat map, with values at the centerline corresponding to the diameter of the luminal area (blue: 0 ?m; dark red: 6 ?m) of tubules shown in B. (D, E, F) Semiquantitative analysis of length, diameter, and volume of treated ZFL tubules (n = 8) in terms of fold change as compared to the mean of control ZFL tubules (n = 4). Box plots are shown. *p < 0.05. ns: p > 0.05. |

Localization of gentamicin-induced tubular damage.
(A) Rendered renal tubules are divided into PCT and PST. Distances to the turning point (TP, defined as zero) are indicated in the direction of the glomerulus (negative values) and towards the cloaca (positive values). (B) The plot of tubule cross-section area against distance from TP. Gentamicin treatment: 1 nL of 42 mM gentamicin, analysis 24 hpi injection. Symbols: mean cross-sectional area, color coded with respect to significant differences between control (n = 4) and gentamicin (n = 8) treated ZFL. Green symbols: p > 0.05. Red symbols: p < 0.05. |
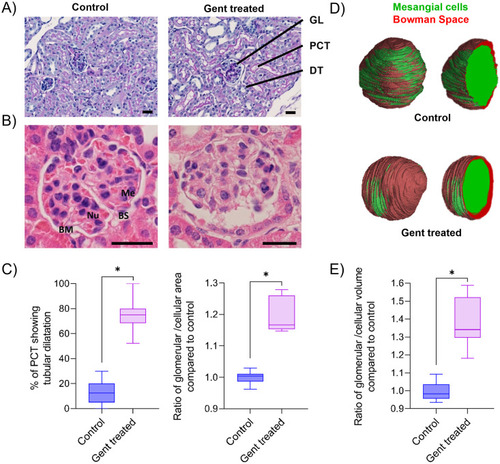
2D and 3D assessment of kidney damage in gentamicin-treated mice.
(A) Representative PAS-stained histology slices (3 ?m) from a kidney biopsy of a control and a gentamicin-treated mouse. Gentamicin treatment: daily i.p. injections for ten days of 150 mg gentamicin. Glomerulus = GL, proximal convoluted tubules = PCT, distal tubules = DT. (B) Representative images of an H&E stained 3 ?m histological slice of a glomerulus of control and a gentamicin-treated mouse. Mesangial cells = Me, Nuclei = Nu, basal membrane = BM, basal space = BS. (C) Semiquantitative analysis of % of PCT showing tubular dilatation and the ratio of glomerular to cellular area normalized to the mean of the control. 180 PCT of three mice (control or treated) and 30 glomeruli of six mice (control or treated) were analyzed, respectively. (D) SR?CT analysis and visualization of a representative 3D rendered glomerulus of a control and a gentamicin-treated mouse. Mesangial cells are labelled in green, and Bowman?s space in red. (E) SR?CT-based analysis of the ratio of glomerular to cellular volume as compared to the mean of the control. Box plots are shown of five manually segmented glomeruli of three mice each. *p < 0.01. Scale bar: 25 ?m. |