
- Title
-
Ripply suppresses Tbx6 to induce dynamic-to-static conversion in somite segmentation
- Authors
- Yabe, T., Uriu, K., Takada, S.
- Source
- Full text @ Nat. Commun.

a Schematic illustration of Tbx6, ripply1 and ripply2 expression during zebrafish somitogenesis. b Schematic representation of somite boundary structure in wild-type (left) and tbx6 or ripply1/2 double-deficient embryos (right). In wild-type embryos, fibronectin is assembled at the somite boundary. In addition, cells adjacent to somite boundaries are epithelialized with accumulation of F-Actin at the basal domain25. c Schematic representation of transplantation experiment. Rhodamine/Biotin-labeled cells from tbx6-or ripply1/2 double-deficient embryos were transplanted to the lateral margin of the tbx6 deficient host embryo at the dome-40% epiboly stage. Chimeric embryos were fixed at somite stages 8–9 and flat-mounted after IHC staining. The green box indicates the approximate area observed in (d, e) and Supplementary Fig. 2. d, e IHC staining of fibronectin (green) and Tbx6 (blue) in tbx6-deficient embryos with transplanted tbx6-deficient donor cells(d; n = 16) and ripply1/2 double-deficient donor cells (e; n = 17). Donor cells were detected with rhodamine labeled streptavidin (red). (d’,d”,e’,e”) High-magnification images of the area indicated by yellow boxes in (d) and (e). Aligned nuclei are indicated by white arrow-heads in (e”). Scale bar indicates 50 µm in (d). |
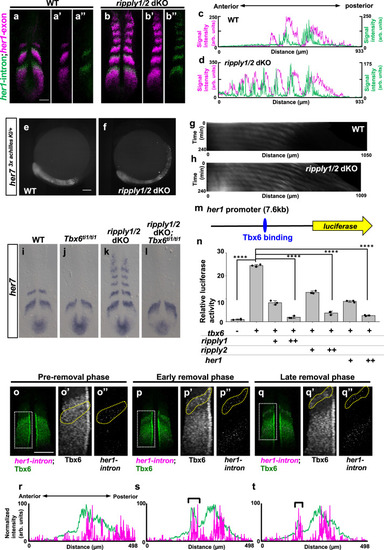
a, b Double in situ hybridization analysis of mature her1 mRNA (magenta) and nascent her1 mRNA (green), detected with exon and intron probes, respectively, at the 6-somite stage of WT (a, n = 3) and ripply1kt1032/kt1032; ripply2kt1034/kt1034 embryos (b, n = 3). Scale bar indicates 100 µm. c, d Signal intensity plots of a and b with anterior toward left. e–h Fluorescent signal of Achilles (e; n = 2, f; n = 3) and kymograph of dynamics of Her7-3xAchilles oscillation in WT (g) and ripply1kt1032/kt1032; ripply2kt1034/kt1034 (h) embryo carrying her73xachilles-KI heterozygous alleles. Scale bar indicates 100 µm. The posterior end of the PSM is aligned at the left side at all time points. i–l Epistatic analysis of ripply1/2 and tbx6 in regulation of segmentation clock gene expression at the anterior paraxial mesoderm. her7 mRNA expression in WT (i; n = 6), tbx6ti1/ti1 (j; n = 7), ripply1kt1032/kt1032; ripply2kt1034/kt1034 (k; n = 3) and ripply1kt1032/kt1032; ripply2kt1034/kt1034; tbx6ti1/ti1 (l; n = 2) at the 6-somite-stage. m, n Reporter assay showing the effects of Tbx6 and Ripply on activity of her1 promoter in HEK 293T cells. A schematic illustration of a luciferase reporter construct is shown in m. Crosses under each bar indicate amounts of plasmids used for transfection. The average of normalized firefly luciferase activity with pCS2 + (mock) alone was set at 1. Error bars represent standard deviations (n = 3 in each experiment). Differences in relative luciferase activity were statistically evaluated using one-way ANOVA followed by the Tukey–Kramer test. ****p < 0.0001. o–t Double staining of Tbx6 protein (green) and her1 nascent mRNA (magenta) at the 6–7 somite-stage. The phase of somitogenesis was estimated by the degree of Tbx6 protein removal in the future somite area (o; n = 5, p; n = 3, q; n = 4). Magnified images of individual channels surrounded by white dotted squares are shown in the right. Areas surrounded by yellow dotted lines indicate the most anterior stripe of her1 transcription. Scale bar indicates 100 µm. Relative intensity of Tbx6 and her1 shown in (o, p, q) is plotted in (r, s, t), respectively, with anterior toward left. Black brackets indicate the position of the anterior band of Tbx6 protein. |

a–f Comparison of ripply1, ripply2 and her1 transcribing areas with Her1 protein-expressing area. The Her1 protein-expressing area was represented by IHC using anti-GFP antibody in TG(her1:her1-venus) heterozygous embryos (green). ripply1, ripply2 and her1-expressing areas are represented by FISH using intron probes for ripply1 (a; n = 8), ripply2 (b; n = 8) and her1 (c; n = 4) to detect nascent mRNAs, respectively (magenta). Left-half images of individual channels are shown in right panels. A white bracket indicates the position of the anterior PSM. Scale bar indicates 100 µm. d–f Signal intensity plots of (a–c) with anterior toward the left. A black bracket indicates the position of the anterior PSM. g–j Analysis of ripply1 (g, i) and ripply2 (h, j) expression in her1;her7 double-mutant embryo. WT (g; n = 15, h; n = 16) and her1k1060/kt1060; her7kt1061/kt1061 (i; n = 10, j; n = 11) embryos were fixed at 8–9 somite stage. k–n Analysis of effects of her1 overexpression on the ripply1 (k; n = 7, l; n = 5) and ripply2 (m; n = 11, n; n = 13) expression. Embryos obtained by crossing Tg(hsp:her1)/+ males with wild-type females were fixed at the 8–9-somite stage after 30 min incubation at 37 °C. o, p Reporter assay showing effects of her1 expression on the activity of the ripply2 promoter using HEK293T cells. o Schematic image of a reporter construct used for the reporter assay. The putative Her1/Her7 binding site indicates previously identified zebrafish Her1/Her7 consensus binding sequences, CACGNG. In the ripply2-8kb (mut)-luc construct, all CACGNG motifs were substituted to AAAGNG or AAAAAA. Crosses under each bar indicates amounts of plasmids used for transfection. Average of normalized firefly luciferase activity with pCS2+ (mock) alone was set at 1. Error bars represent standard deviations (n = 3 in each experiment). Differences of relative luciferase activity were statistically evaluated using one-way ANOVA followed by the Tukey–Kramer test. *p = 0.03, **p = 0.001 ****p < 0.0001. |
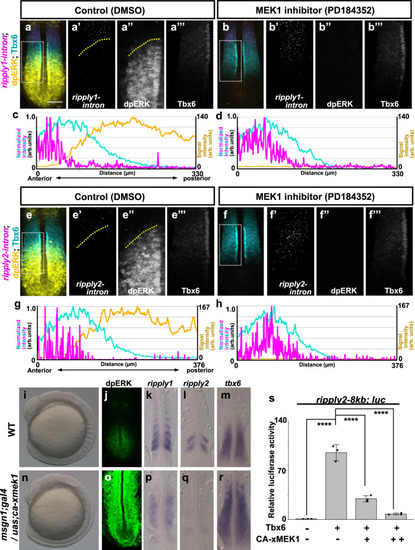
a–h Effect of ERK inhibition on expression of ripply1 (a–d) and ripply2 (e–h). Embryos were fixed at the 8-somite stage after 15 min treatment with 0.01% DMSO (a; n = 4, e; n = 5) or 10 µM PD184352 (b; n = 5, f; n = 5). The area of ripply transcription was represented by FISH using an intron probe (magenta) with co-staining of Tbx6 protein (cyan) and dpERK (yellow) by IHC. Magnified images of individual channels surrounded by white dotted squares are shown in the right panel. Yellow dotted lines indicate the anterior end of the dpERK signal gradient in the control embryo. Quantified signal intensity of (a, b, e, f) was plotted in (c, d, g, h) with anterior toward the left. Scale bar indicates 100 µm. i–r Effects of ERK over-activation on somitogenesis and ripply1 and ripply2 expression. Live phenotype of control WT (i) and msgn1;gal4/uas;ca-xmek1 (n)embryo at the 8-somite stage. WT (j–m) and msgn1;gal4/uas;ca-xmek1 (o–r) embryos were fixed at the 8-somite stage and stained dpERK (j; n = 3, o; n = 3) with IHC or ripply1 (k; n = 8, p; n = 8), ripply2 (l; n = 10, q; n = 8) and tbx6 (m; n = 8, r; n = 7) mRNA by WISH. Embryos were mounted after yolk removal with heads toward the upper side. s Reporter assay showing effects of ERK over-activation on activity of the ripply2 promoter using HEK293T cells. Crosses under each bar indicate amounts of plasmids used for transfection. The average of normalized firefly luciferase activity with pCS2+ (mock) alone was set at 1. Error bars represent standard deviations (n = 3 in each experiment). Differences of relative luciferase activity were statistically evaluated using one-way ANOVA followed by the Tukey–Kramer test. ****p < 0.0001. |

a–l series of fixed tg(her1:her1-venus) heterozygous embryos at the 7-somite stage stained Her1-venus protein (yellow) and dpERK (cyan) with ripply1 (magenta; a–c) and ripply2 (magenta; g– |
|