
|
Fig. 2
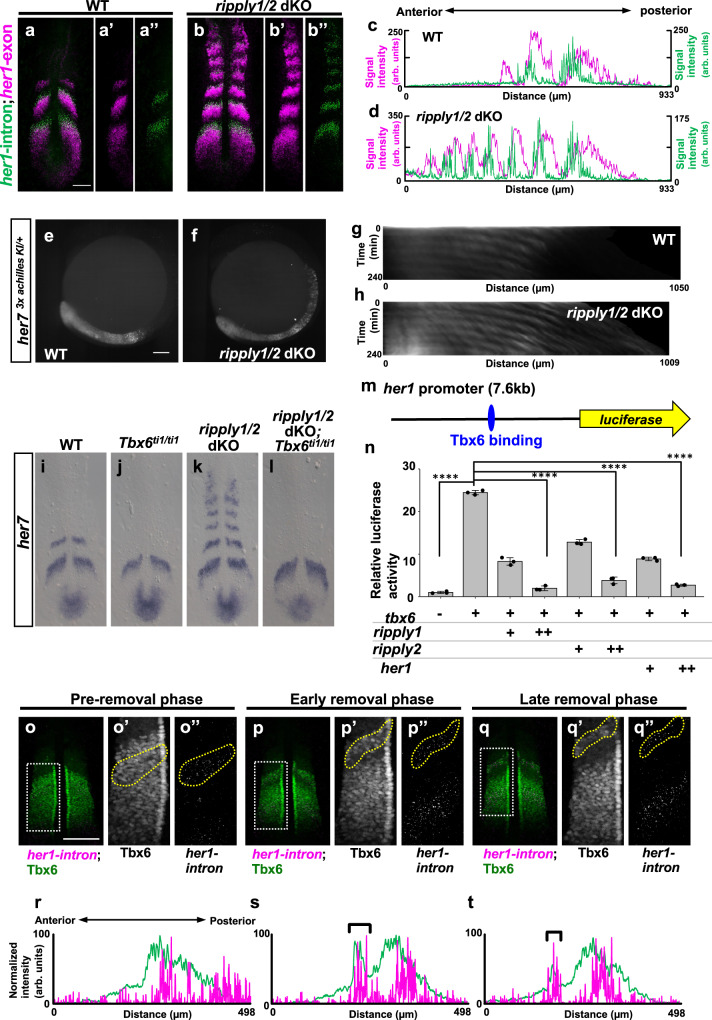
a, b Double in situ hybridization analysis of mature her1 mRNA (magenta) and nascent her1 mRNA (green), detected with exon and intron probes, respectively, at the 6-somite stage of WT (a, n = 3) and ripply1kt1032/kt1032; ripply2kt1034/kt1034 embryos (b, n = 3). Scale bar indicates 100 µm. c, d Signal intensity plots of a and b with anterior toward left. e–h Fluorescent signal of Achilles (e; n = 2, f; n = 3) and kymograph of dynamics of Her7-3xAchilles oscillation in WT (g) and ripply1kt1032/kt1032; ripply2kt1034/kt1034 (h) embryo carrying her73xachilles-KI heterozygous alleles. Scale bar indicates 100 µm. The posterior end of the PSM is aligned at the left side at all time points. i–l Epistatic analysis of ripply1/2 and tbx6 in regulation of segmentation clock gene expression at the anterior paraxial mesoderm. her7 mRNA expression in WT (i; n = 6), tbx6ti1/ti1 (j; n = 7), ripply1kt1032/kt1032; ripply2kt1034/kt1034 (k; n = 3) and ripply1kt1032/kt1032; ripply2kt1034/kt1034; tbx6ti1/ti1 (l; n = 2) at the 6-somite-stage. m, n Reporter assay showing the effects of Tbx6 and Ripply on activity of her1 promoter in HEK 293T cells. A schematic illustration of a luciferase reporter construct is shown in m. Crosses under each bar indicate amounts of plasmids used for transfection. The average of normalized firefly luciferase activity with pCS2 + (mock) alone was set at 1. Error bars represent standard deviations (n = 3 in each experiment). Differences in relative luciferase activity were statistically evaluated using one-way ANOVA followed by the Tukey–Kramer test. ****p < 0.0001. o–t Double staining of Tbx6 protein (green) and her1 nascent mRNA (magenta) at the 6–7 somite-stage. The phase of somitogenesis was estimated by the degree of Tbx6 protein removal in the future somite area (o; n = 5, p; n = 3, q; n = 4). Magnified images of individual channels surrounded by white dotted squares are shown in the right. Areas surrounded by yellow dotted lines indicate the most anterior stripe of her1 transcription. Scale bar indicates 100 µm. Relative intensity of Tbx6 and her1 shown in (o, p, q) is plotted in (r, s, t), respectively, with anterior toward left. Black brackets indicate the position of the anterior band of Tbx6 protein.