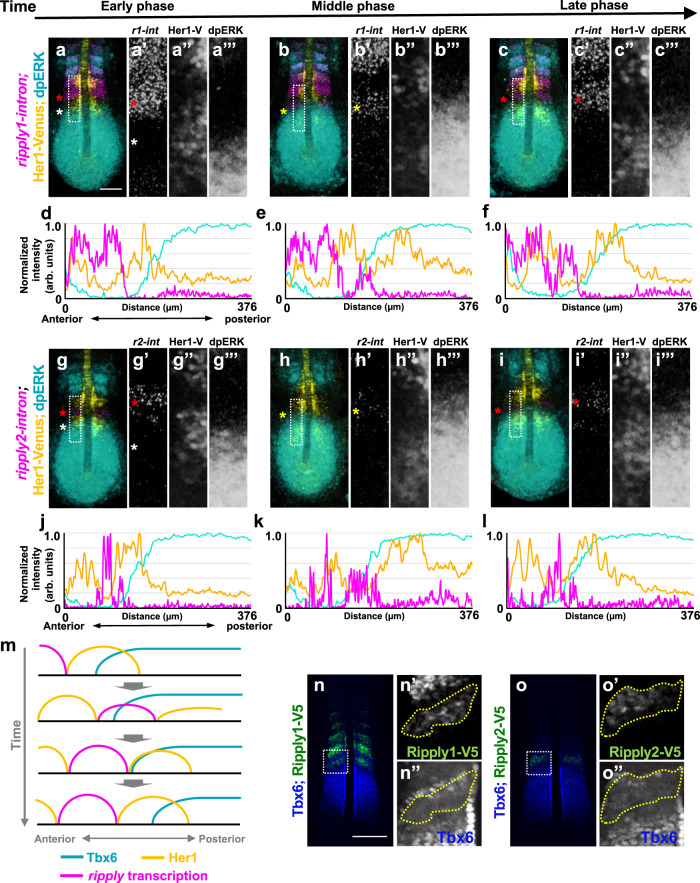
IMAGE

Fig. 5

ID
ZDB-IMAGE-230420-57
Source
Figures for Yabe et al., 2023
Image
Figure Caption

Fig. 5 Dynamics of expression of proteins and mRNA involved in definition of the somite boundary during somitogenesis.

al series of fixed tg(her1:her1-venus) heterozygous embryos at the 7-somite stage stained Her1-venus protein (yellow) and dpERK (cyan) with ripply1 (magenta; ac) and ripply2 (magenta; gi) nascent mRNA. Magnified images of individual channels surrounded by white dotted squares are shown in the right panel. Phase was estimated by the relative position of Her1-venus stripes and anterior end of the dpERK signal gradient (a; n = 10, b; n = 8, cn = 12, g; n = 9, h; n = 7, i; n = 9). Quantified signal intensity of (ac, gi) was plotted in (df, jl) with anterior toward the left. m Schematic illustration of dynamics of Her1, Tbx6 proteins, and ripply1 and ripply2 transcription during zebrafish somitogenesis. n, o Double staining of Tbx6 protein (Blue) with Ripply1-V5 (n; green) or Ripply2-V5 (o; green). ripply1v5/+ and ripply2v5/v5 embryos were fixed at the 6–7 somite stage (n; n = 8, o; n = 9). Magnified images of individual channels surrounded by white dotted squares are shown right. Areas surrounded by a yellow dotted line indicate the most posterior domain of Ripply protein expression. Scale bar indicates 100 μm.

Acknowledgments
This image is the copyrighted work of the attributed author or publisher, and ZFIN has permission only to display this image to its users. Additional permissions should be obtained from the applicable author or publisher of the image. Full text @ Nat. Commun.