IMAGE

Fig. 6

ID
ZDB-IMAGE-230420-40
Source
Figures for Yabe et al., 2023
Image
Figure Caption

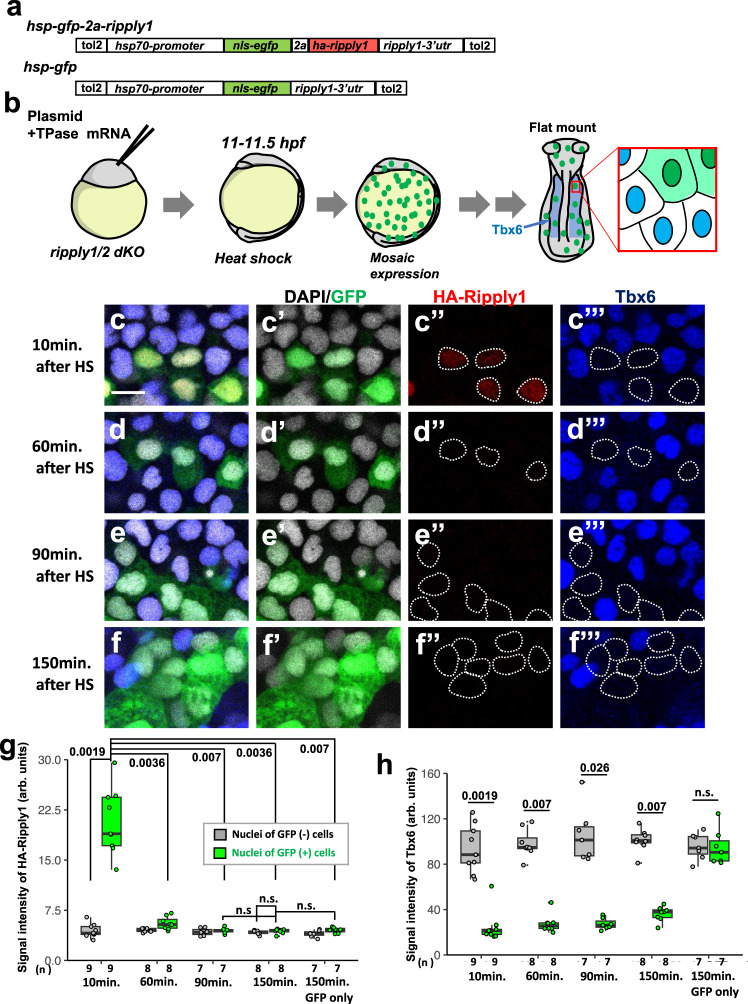
Fig. 6 Repression of Tbx6 is sustained for almost two somite cycles by transient expression of Ripply in ripply dKO embryos.a Schematic representation of DNA constructs. nls-EGF and HA-tagged Ripply were separately expressed by 2A-peptide under-control of the hsp70 promoter. A Tol2 inverted repeat sequence was introduced on both sides of the insertion to improve efficiency of genomic integration. b Schematic representation of the transient ripply expression assay in the anterior paraxial mesodermal region of ripply dKO embryo. Twenty-five pg of plasmid DNA were injected into the ripply1kt1032 and ripply2kt1034 double-homozygous eggs. Embryos were incubated in a 38 °C water bath for 30 min. at 11 hpf (3-somite stage) to achieve mosaic expression of transgenes. Expression of Tbx6 and HA-Ripply1 were assessed in anterior paraxial mesoderm, in which ectopic expression of Tbx6 is maintained at ripply dKO embryos, after 10–150 min incubation at 28 °C. cf IHC staining of GFP (green), HA-Ripply1 (red) and Tbx6 (blue) in the anterior paraxial mesodermal region of ripply dKO embryo at 10, 60, 90, and 150 min. after HS treatment (cf). Nuclei were counterstained with DAPI. Individual channels are shown at right. Areas surrounded with dotted white lines indicate the position of nuclei of GFP-expressing cells. Scale bar indicates 10μm. g, h A statistical summary of this experiment. The intensity of HA-Ripply1 (g) and Tbx6 (h) was quantified in nuclei indicated by DAPI staining. The group of GFP only indicates the embryos injected hsp-gfp construct represented in (a) as a negative control. Box plots of medians of signal intensity in each embryo show the first and third quartile, the median is represented by a line, whiskers indicate the minimum and maximum, and outliers are shown as dots outside the box. Differences of signal intensity were evaluated by pairwise comparisons using the two-sided Wilcoxon rank sum test adjusted for multiple comparison with Bonferroni’s method. *p-values are shown at the top of boxes.

Acknowledgments
This image is the copyrighted work of the attributed author or publisher, and ZFIN has permission only to display this image to its users. Additional permissions should be obtained from the applicable author or publisher of the image. Full text @ Nat. Commun.