
- Title
-
Preclinical Evidence of Progesterone as a New Pharmacological Strategy in Human Adrenocortical Carcinoma Cell Lines
- Authors
- Tamburello, M., Abate, A., Rossini, E., Basnet, R.M., Zizioli, D., Cosentini, D., Hantel, C., Laganà, M., Tiberio, G.A.M., Grisanti, S., Memo, M., Berruti, A., Sigala, S.
- Source
- Full text @ Int. J. Mol. Sci.

Pg induced a reduction in the tumor xenograft area of ACC cells. (A) Representative, lateral-view pictures of Tg (kdrl: EGFP) control and Pg-treated embryos at 120 hpf. Each ACC cell line was labeled with a red fluorescent lipophilic dye while the embryo endothelium was labeled with a green fluorescent protein reporter driven by the kdrl promoter. Images were acquired using a Zeiss LSM 510 META confocal laser scanning microscope at 10× magnification. (B) Tumor areas at 48 hpf (T0—the start of treatment) and 120 hpf (T3—end of treatment) of drug-treated and vehicle-treated groups measured using Zen 2.3 Black software from ZEISS. Data are shown as the mean of independent experiments ± SEM. * p < 0.0001; § p < 0.05. |
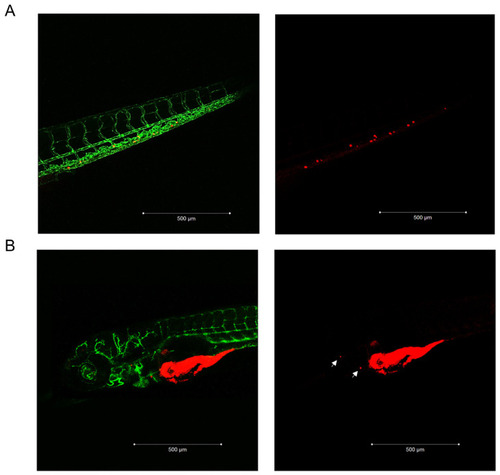
MUC-1 and TVBF-7 ACC cells induced metastases formation in zebrafish embryos. (A) Enlargement of the embryo tail with metastasized MUC-1 cells. (B) A representative acquisition of the metastases of TVBF-7 cells in the pericardial area of the embryo is shown. Cells are labeled with a red fluorescent lipophilic dye while the embryos’ endothelium is labeled with a green fluorescent protein reporter driven by the kdrl promoter. Images were acquired at 120 hpf using a Zeiss LSM 510 META confocal laser scanning microscope at 10× magnification. |
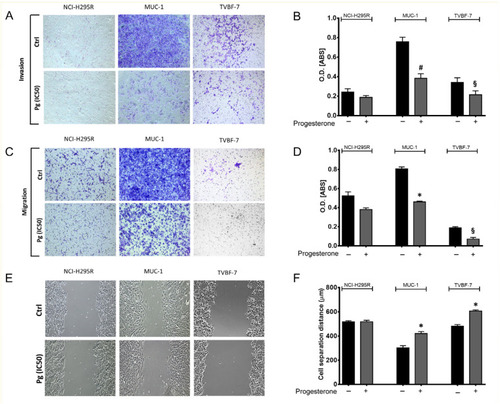
Pg suppressed ACC cell invasion (A) and migration (C) ability in transwell assays. Images were acquired using an Olympus IX51 optical microscope at 10× magnification. (B,D) Quantification of the number of invasive and migrated cells was analyzed using the absorbance of the staining detected at 560 nm. (E) Representative images of wound healing assay used to detect migrated ACC cells. (F) The distance between each edge of the scratch was measured using NIH ImageJ Software V 1.52a. Images were acquired using an Olympus IX51 optical microscope equipped with a 10× objective. Data are shown as the mean ± SEM of three independent experiments. * p < 0.0001, # p < 0.001, § p < 0.05 vs. untreated cells. |

The secretion and the activity of MMP 2 were decreased after Pg treatment. (A) Representative Western blot of MMP2 in the conditioned medium secreted by ACC cells. (C) Representative zymogram of MMP2 in the conditioned medium secreted by ACC cells. (B,D) Quantification of Western blots and zymography. Results are presented as the mean relative optical density ± SEM of three independent experiments. * p < 0.0001, § p < 0.05 vs. untreated cells. |
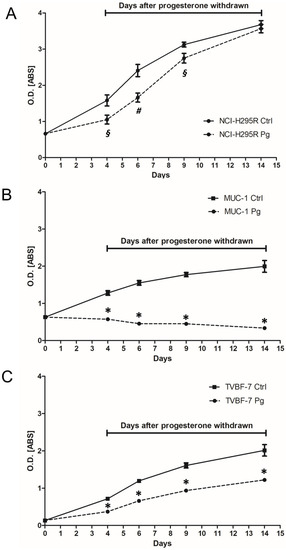
Effect of drug withdrawal on NCI-H295R (A), MUC-1 (B), and TVBF-7 (C) ACC cell lines. Cells were treated for 4 days with respective IC50 values of Pg; then, the drug was withdrawn from the medium, and cells were kept in culture for up to 10 days. The cell viability time course was measured by the MTT assay. Points represent the mean ± SEM of at least three experiments performed in triplicate. * p < 0.0001, # p < 0.001, § p < 0.05 vs. untreated cells. |
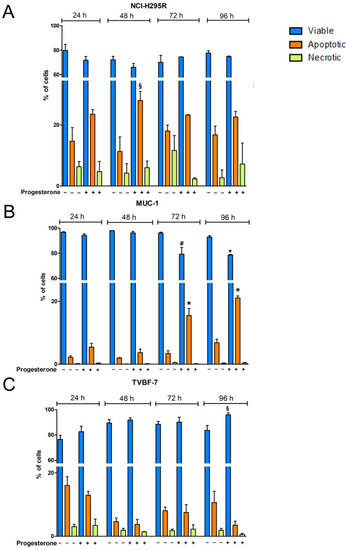
Pg promoted apoptotic cell death in NCI-H295R (A) and MUC-1 (B) cell lines but not in TVBF-7 cells (C). Cells were treated for 24, 48, 72, or 96 h using their Pg IC50 values, stained with Pacific BlueTM annexin V, and analyzed by flow cytometry. Histograms representative of the mean ± SEM of three experiments are shown. * p < 0.0001, # p < 0.001 cells, § p < 0.05 vs. untreated cells. |
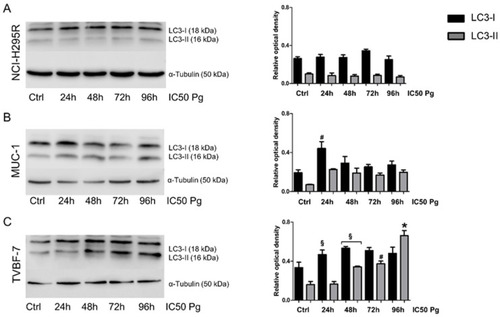
Pg triggered autophagy cell death in TVBF-7 cell lines. Representative Western blot of LC3-I and LC3-II protein levels in NCI-H295R (A), MUC-1 (B), and TVBF-7 (C) are shown. On the right side, quantification results are presented as a relative optical density means ± SEM of three independent experiments. * p < 0.0001, # p < 0.001, § p < 0.05 vs. untreated cells. |

Pg-induced changes in the cell-cycle distribution of ACC cell lines. Cells were treated for 72 h (A) and 96 h (B) with respective IC50 values of Pg, stained with propidium iodide, and analyzed for DNA content by flow cytometry. Histograms representative of the mean ± SEM of three experiments are shown. # p < 0.001, § p < 0.05 vs. untreated cells. |